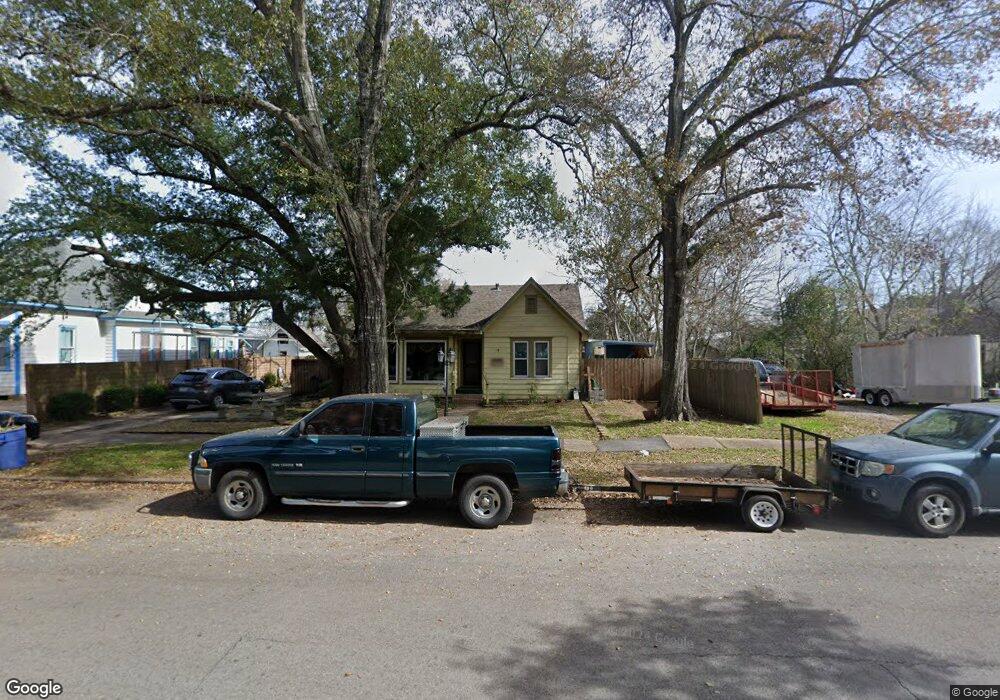
1409 3rd St Rosenberg, TX 77471
Estimated Value: $189,000 - $234,000
Studio
--
Bath
1,491
Sq Ft
$148/Sq Ft
Est. Value
About This Home
This home is located at 1409 3rd St, Rosenberg, TX 77471 and is currently estimated at $220,072, approximately $147 per square foot. 1409 3rd St is a home located in Fort Bend County with nearby schools including Taylor Ray Elementary School, George Junior High School, and B.F. Terry High School.
Ownership History
Date
Name
Owned For
Owner Type
Purchase Details
Closed on
Jan 26, 2024
Sold by
Yanez Dolores Moncada
Bought by
Yanez Albert and Yanez Dolores Moncada
Current Estimated Value
Purchase Details
Closed on
Jun 13, 2014
Sold by
Chandler Charles A and Chandler James C
Bought by
Yanez Albert and Yanez Dolores M
Purchase Details
Closed on
May 23, 2014
Sold by
Bowen Susan Jean
Bought by
Yanez Albert and Yanez Dolores M
Purchase Details
Closed on
Aug 24, 1990
Sold by
Beard Lee J
Bought by
Moncada Dolores
Create a Home Valuation Report for This Property
The Home Valuation Report is an in-depth analysis detailing your home's value as well as a comparison with similar homes in the area
Home Values in the Area
Average Home Value in this Area
Purchase History
| Date | Buyer | Sale Price | Title Company |
|---|---|---|---|
| Yanez Albert | -- | None Listed On Document | |
| Yanez Albert | -- | Stewart Title | |
| Yanez Albert | -- | Stewart Title | |
| Moncada Dolores | -- | -- |
Source: Public Records
Tax History
| Year | Tax Paid | Tax Assessment Tax Assessment Total Assessment is a certain percentage of the fair market value that is determined by local assessors to be the total taxable value of land and additions on the property. | Land | Improvement |
|---|---|---|---|---|
| 2025 | $504 | $221,945 | $78,211 | $158,859 |
| 2024 | $504 | $201,768 | $34,429 | $167,339 |
| 2023 | $504 | $183,425 | $1,689 | $181,736 |
| 2022 | $1,455 | $166,750 | $3,150 | $163,600 |
| 2021 | $3,145 | $151,590 | $55,180 | $96,410 |
| 2020 | $2,925 | $137,810 | $54,450 | $83,360 |
| 2019 | $2,861 | $125,280 | $32,690 | $92,590 |
| 2018 | $2,643 | $113,890 | $32,690 | $81,200 |
| 2017 | $2,417 | $103,540 | $32,690 | $70,850 |
| 2016 | $2,341 | $100,280 | $32,690 | $67,590 |
| 2015 | $1,853 | $98,880 | $32,690 | $66,190 |
| 2014 | $1,867 | $92,270 | $32,690 | $59,580 |
Source: Public Records
Map
Nearby Homes
Your Personal Tour Guide
Ask me questions while you tour the home.