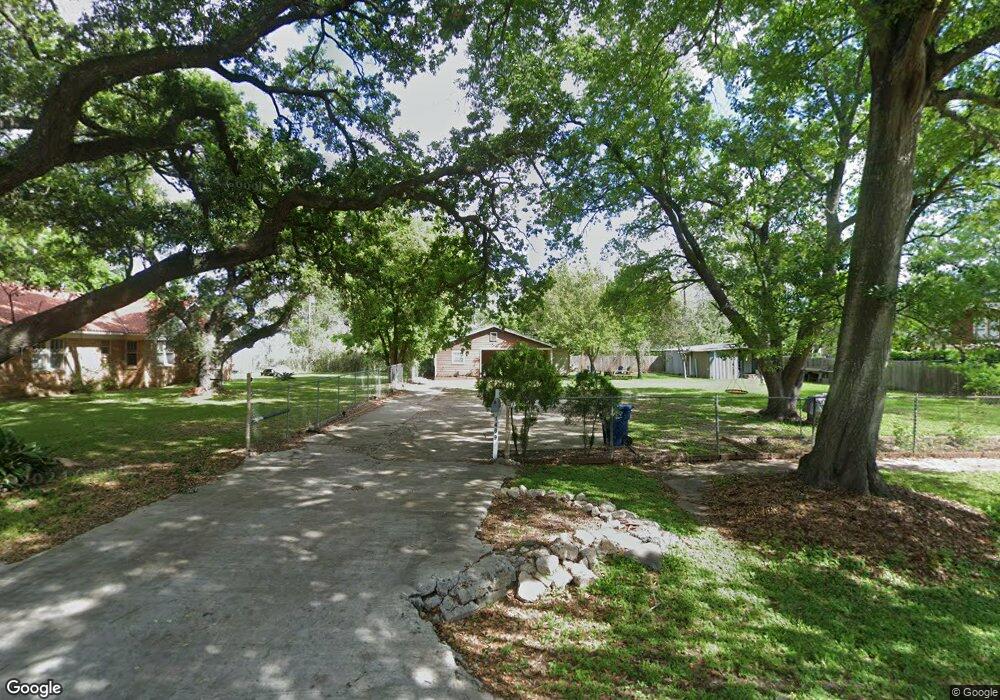
1409 5th St Bay City, TX 77414
Estimated Value: $97,000 - $132,000
--
Bed
--
Bath
744
Sq Ft
$153/Sq Ft
Est. Value
About This Home
This home is located at 1409 5th St, Bay City, TX 77414 and is currently estimated at $114,015, approximately $153 per square foot. 1409 5th St is a home with nearby schools including John H. Cherry Elementary School, Bay City Junior High School, and Bay City High School.
Ownership History
Date
Name
Owned For
Owner Type
Purchase Details
Closed on
Aug 14, 2024
Sold by
Garcia Joaquin and Amezquita Rosa
Bought by
Marquez Hugo F and Flores Elva E
Current Estimated Value
Home Financials for this Owner
Home Financials are based on the most recent Mortgage that was taken out on this home.
Original Mortgage
$83,000
Outstanding Balance
$70,010
Interest Rate
6.95%
Mortgage Type
Seller Take Back
Estimated Equity
$44,005
Purchase Details
Closed on
Oct 19, 2012
Sold by
Garcia Jesus
Bought by
Garcia Joaquin
Create a Home Valuation Report for This Property
The Home Valuation Report is an in-depth analysis detailing your home's value as well as a comparison with similar homes in the area
Home Values in the Area
Average Home Value in this Area
Purchase History
| Date | Buyer | Sale Price | Title Company |
|---|---|---|---|
| Marquez Hugo F | -- | None Listed On Document | |
| Garcia Joaquin | -- | None Available |
Source: Public Records
Mortgage History
| Date | Status | Borrower | Loan Amount |
|---|---|---|---|
| Open | Marquez Hugo F | $83,000 |
Source: Public Records
Tax History Compared to Growth
Tax History
| Year | Tax Paid | Tax Assessment Tax Assessment Total Assessment is a certain percentage of the fair market value that is determined by local assessors to be the total taxable value of land and additions on the property. | Land | Improvement |
|---|---|---|---|---|
| 2024 | $26 | $110,460 | $21,000 | $89,460 |
| 2023 | $2,286 | $98,090 | $15,000 | $83,090 |
| 2022 | $1,819 | $68,120 | $15,000 | $53,120 |
| 2021 | $2,183 | $74,310 | $10,880 | $63,430 |
| 2020 | $1,800 | $58,910 | $10,880 | $48,030 |
| 2019 | $1,783 | $58,360 | $10,880 | $47,480 |
| 2018 | $1,735 | $58,880 | $10,880 | $48,000 |
| 2017 | $1,673 | $59,930 | $10,880 | $49,050 |
| 2016 | $1,635 | $58,560 | $10,880 | $47,680 |
| 2015 | -- | $56,530 | $10,880 | $45,650 |
| 2014 | -- | $51,860 | $10,880 | $40,980 |
Source: Public Records
Map
Nearby Homes