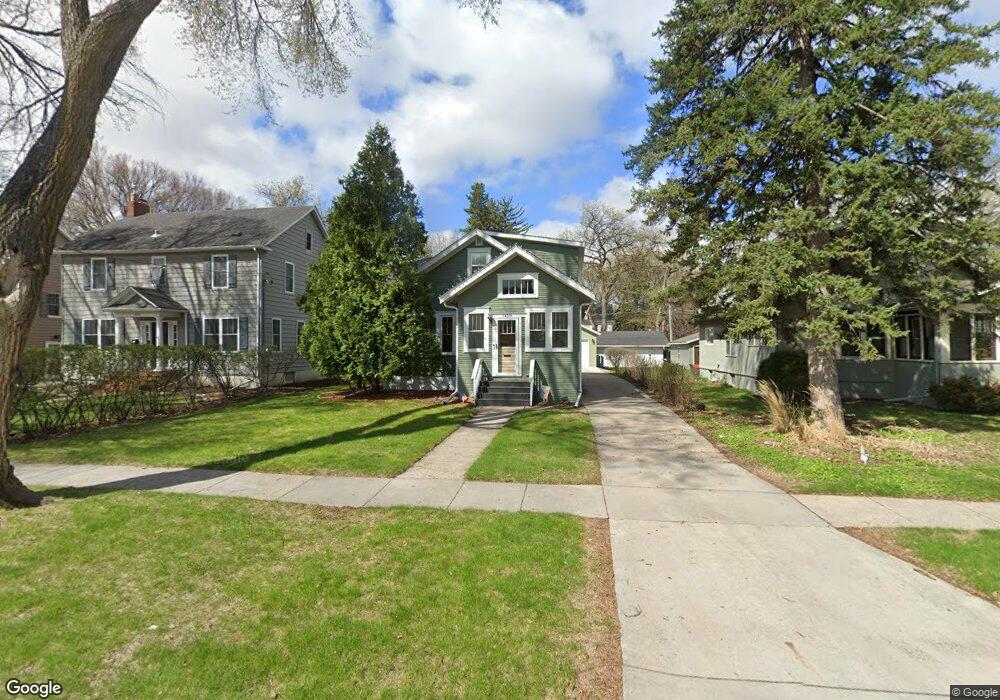
1409 8th St S Fargo, ND 58103
Clara Barton NeighborhoodEstimated Value: $337,000 - $442,000
5
Beds
2
Baths
3,083
Sq Ft
$125/Sq Ft
Est. Value
About This Home
This home is located at 1409 8th St S, Fargo, ND 58103 and is currently estimated at $385,411, approximately $125 per square foot. 1409 8th St S is a home located in Cass County with nearby schools including Clara Barton Elementary School, Carl Ben Eielson Middle School, and South High School.
Ownership History
Date
Name
Owned For
Owner Type
Purchase Details
Closed on
Dec 22, 2020
Sold by
Fwb Investments Llc
Bought by
Teske Connor W and Teske Sara S
Current Estimated Value
Home Financials for this Owner
Home Financials are based on the most recent Mortgage that was taken out on this home.
Original Mortgage
$227,700
Outstanding Balance
$203,082
Interest Rate
2.8%
Mortgage Type
New Conventional
Estimated Equity
$182,329
Purchase Details
Closed on
Aug 12, 2019
Sold by
Valley Property Partners Llc
Bought by
Fwb Investments Llc
Home Financials for this Owner
Home Financials are based on the most recent Mortgage that was taken out on this home.
Original Mortgage
$133,316
Interest Rate
3.7%
Mortgage Type
Commercial
Purchase Details
Closed on
Aug 8, 2019
Sold by
Mcmullen Michael and Mcmullen Catherine
Bought by
Walley Property Partners Llc
Home Financials for this Owner
Home Financials are based on the most recent Mortgage that was taken out on this home.
Original Mortgage
$133,316
Interest Rate
3.7%
Mortgage Type
Commercial
Purchase Details
Closed on
Oct 17, 1990
Sold by
Mcmulln Marcia
Bought by
Mcmullen Michael
Create a Home Valuation Report for This Property
The Home Valuation Report is an in-depth analysis detailing your home's value as well as a comparison with similar homes in the area
Home Values in the Area
Average Home Value in this Area
Purchase History
| Date | Buyer | Sale Price | Title Company |
|---|---|---|---|
| Teske Connor W | $253,000 | Fm Title | |
| Fwb Investments Llc | $120,000 | Regency Title Inc | |
| Walley Property Partners Llc | $100,000 | Regency Title Inc | |
| Mcmullen Michael | -- | -- |
Source: Public Records
Mortgage History
| Date | Status | Borrower | Loan Amount |
|---|---|---|---|
| Open | Teske Connor W | $227,700 | |
| Previous Owner | Fwb Investments Llc | $133,316 |
Source: Public Records
Tax History
| Year | Tax Paid | Tax Assessment Tax Assessment Total Assessment is a certain percentage of the fair market value that is determined by local assessors to be the total taxable value of land and additions on the property. | Land | Improvement |
|---|---|---|---|---|
| 2024 | $4,563 | $175,600 | $39,300 | $136,300 |
| 2023 | $4,063 | $139,050 | $39,300 | $99,750 |
| 2022 | $4,052 | $136,400 | $39,300 | $97,100 |
| 2021 | $4,178 | $143,650 | $34,050 | $109,600 |
| 2020 | $3,808 | $130,750 | $34,050 | $96,700 |
| 2019 | $3,458 | $118,050 | $21,450 | $96,600 |
| 2018 | $3,417 | $118,050 | $21,450 | $96,600 |
| 2017 | $3,296 | $114,600 | $21,450 | $93,150 |
| 2016 | $2,973 | $111,250 | $21,450 | $89,800 |
| 2015 | $3,073 | $108,550 | $13,250 | $95,300 |
| 2014 | $2,889 | $98,700 | $13,250 | $85,450 |
| 2013 | $3,130 | $98,700 | $13,250 | $85,450 |
Source: Public Records
Map
Nearby Homes
- 1502 8th St S
- 1348 6th St S
- 1301 10th St S
- 1311 5th St S
- 1534 10th St S
- 1550 8th St S
- 1020 6th St S
- 1330 14th St S
- 1364 12th Ave S
- 1329 14th St S
- 817 9th St S
- 337 Elmwood Ave S
- 326 10th Ave S Unit 2
- 812 10th St S Unit B9
- 804 10th St S Unit A4
- 1410 14 1 2 St S
- 1416 14 1 2 St S
- 1630 14th St S
- 1605 14th St S
- 1011 14th St S
Your Personal Tour Guide
Ask me questions while you tour the home.