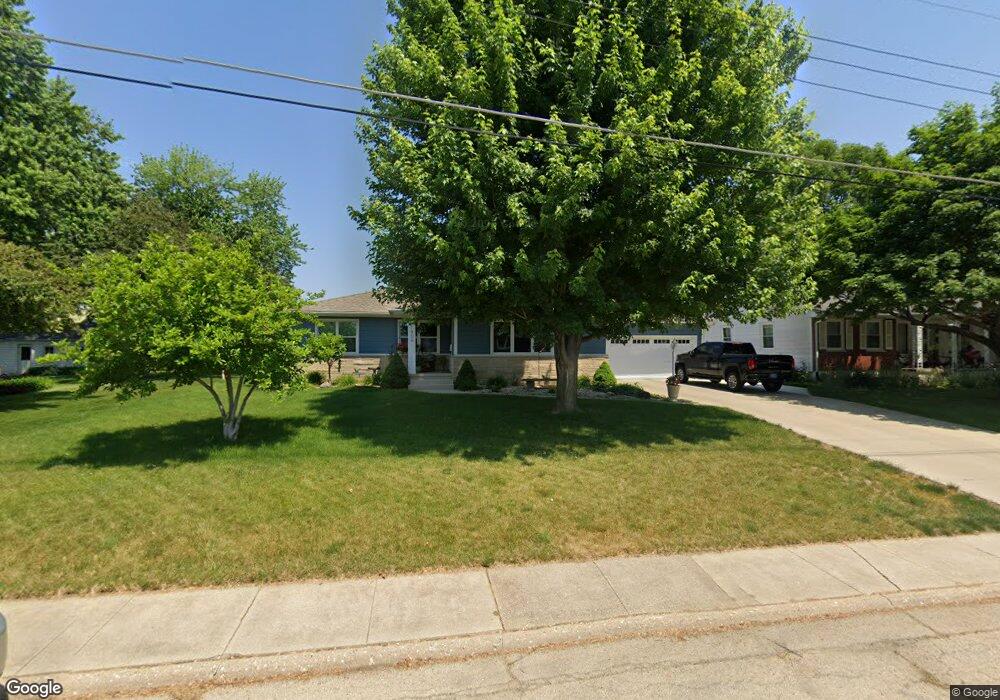
1409 9th Ave Fulton, IL 61252
Estimated Value: $135,000 - $154,000
3
Beds
1
Bath
1,280
Sq Ft
$116/Sq Ft
Est. Value
About This Home
This home is located at 1409 9th Ave, Fulton, IL 61252 and is currently estimated at $148,735, approximately $116 per square foot. 1409 9th Ave is a home located in Whiteside County with nearby schools including Fulton Elementary School, River Bend Middle School, and Fulton High School.
Ownership History
Date
Name
Owned For
Owner Type
Purchase Details
Closed on
Dec 7, 2007
Sold by
Eizenga Ashley
Bought by
Cramer Kelly Sue and Cramer Josh Alan
Current Estimated Value
Home Financials for this Owner
Home Financials are based on the most recent Mortgage that was taken out on this home.
Original Mortgage
$132,850
Outstanding Balance
$84,219
Interest Rate
6.33%
Mortgage Type
New Conventional
Estimated Equity
$64,516
Purchase Details
Closed on
Oct 17, 2006
Sold by
Fannie Mae
Bought by
Eizenga Ashley
Home Financials for this Owner
Home Financials are based on the most recent Mortgage that was taken out on this home.
Original Mortgage
$80,000
Interest Rate
6.5%
Mortgage Type
New Conventional
Purchase Details
Closed on
Aug 8, 2006
Sold by
Matuszewich David
Bought by
Fannie Mae
Create a Home Valuation Report for This Property
The Home Valuation Report is an in-depth analysis detailing your home's value as well as a comparison with similar homes in the area
Home Values in the Area
Average Home Value in this Area
Purchase History
| Date | Buyer | Sale Price | Title Company |
|---|---|---|---|
| Cramer Kelly Sue | $133,000 | None Available | |
| Eizenga Ashley | -- | None Available | |
| Fannie Mae | -- | None Available |
Source: Public Records
Mortgage History
| Date | Status | Borrower | Loan Amount |
|---|---|---|---|
| Open | Cramer Kelly Sue | $132,850 | |
| Previous Owner | Eizenga Ashley | $80,000 |
Source: Public Records
Tax History Compared to Growth
Tax History
| Year | Tax Paid | Tax Assessment Tax Assessment Total Assessment is a certain percentage of the fair market value that is determined by local assessors to be the total taxable value of land and additions on the property. | Land | Improvement |
|---|---|---|---|---|
| 2024 | $3,117 | $44,890 | $7,086 | $37,804 |
| 2023 | $2,851 | $41,534 | $6,556 | $34,978 |
| 2022 | $2,668 | $38,080 | $6,011 | $32,069 |
| 2021 | $2,607 | $37,169 | $5,867 | $31,302 |
| 2020 | $2,652 | $37,760 | $6,073 | $31,687 |
| 2019 | $2,690 | $37,699 | $6,063 | $31,636 |
| 2018 | $2,554 | $36,625 | $5,890 | $30,735 |
| 2017 | $2,558 | $36,471 | $5,865 | $30,606 |
| 2016 | $2,502 | $35,658 | $5,734 | $29,924 |
| 2015 | $2,319 | $34,376 | $5,528 | $28,848 |
| 2014 | $2,361 | $34,781 | $5,593 | $29,188 |
| 2013 | $2,319 | $34,376 | $5,528 | $28,848 |
Source: Public Records
Map
Nearby Homes