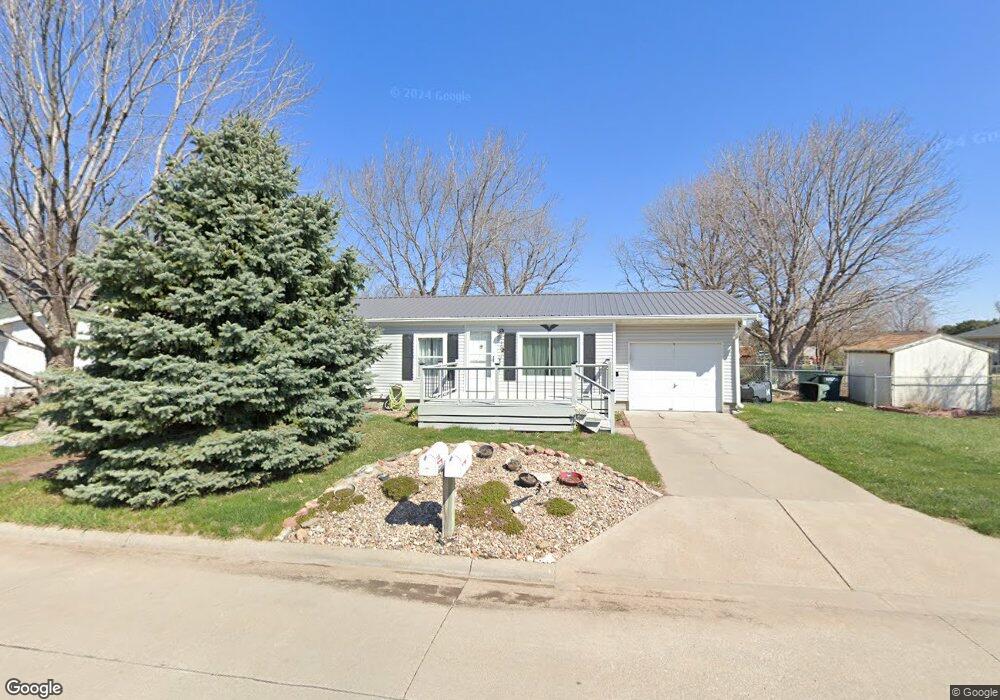
1409 Cherry St Aurora, NE 68818
Estimated Value: $178,000 - $197,000
4
Beds
1
Bath
1,008
Sq Ft
$186/Sq Ft
Est. Value
About This Home
This home is located at 1409 Cherry St, Aurora, NE 68818 and is currently estimated at $187,413, approximately $185 per square foot. 1409 Cherry St is a home located in Hamilton County with nearby schools including Aurora Elementary School, Aurora Middle School, and Aurora High School.
Ownership History
Date
Name
Owned For
Owner Type
Purchase Details
Closed on
Aug 22, 2007
Sold by
Brockemeier Dale and Brockemeier Karla A
Bought by
Nunnenkamp Holee
Current Estimated Value
Home Financials for this Owner
Home Financials are based on the most recent Mortgage that was taken out on this home.
Original Mortgage
$87,000
Outstanding Balance
$53,973
Interest Rate
6.72%
Estimated Equity
$133,440
Purchase Details
Closed on
Feb 7, 2007
Sold by
Deutsche Bank Trust Company Americas
Bought by
Broekemeier Dale and Broekemeier Karla A
Purchase Details
Closed on
Oct 10, 2006
Sold by
Stevens Douglas R
Bought by
Deutsche Bank Trust Co Americas and Meritech Mortgage Services Inc
Create a Home Valuation Report for This Property
The Home Valuation Report is an in-depth analysis detailing your home's value as well as a comparison with similar homes in the area
Home Values in the Area
Average Home Value in this Area
Purchase History
| Date | Buyer | Sale Price | Title Company |
|---|---|---|---|
| Nunnenkamp Holee | $86,000 | -- | |
| Broekemeier Dale | $60,000 | -- | |
| Deutsche Bank Trust Co Americas | $72,250 | -- |
Source: Public Records
Mortgage History
| Date | Status | Borrower | Loan Amount |
|---|---|---|---|
| Open | Nunnenkamp Holee | $87,000 |
Source: Public Records
Tax History
| Year | Tax Paid | Tax Assessment Tax Assessment Total Assessment is a certain percentage of the fair market value that is determined by local assessors to be the total taxable value of land and additions on the property. | Land | Improvement |
|---|---|---|---|---|
| 2025 | $1,476 | $157,430 | $21,460 | $135,970 |
| 2024 | $1,476 | $136,385 | $21,460 | $114,925 |
| 2023 | $1,791 | $126,895 | $21,460 | $105,435 |
| 2022 | $1,898 | $126,895 | $21,460 | $105,435 |
| 2021 | $1,929 | $126,895 | $21,460 | $105,435 |
| 2020 | $1,658 | $111,870 | $21,460 | $90,410 |
| 2019 | $1,548 | $105,170 | $21,460 | $83,710 |
| 2018 | $1,481 | $105,170 | $21,460 | $83,710 |
| 2017 | $1,361 | $96,585 | $12,875 | $83,710 |
| 2016 | $1,321 | $96,585 | $12,875 | $83,710 |
| 2010 | $1,592 | $84,020 | $0 | $0 |
Source: Public Records
Map
Nearby Homes
Your Personal Tour Guide
Ask me questions while you tour the home.