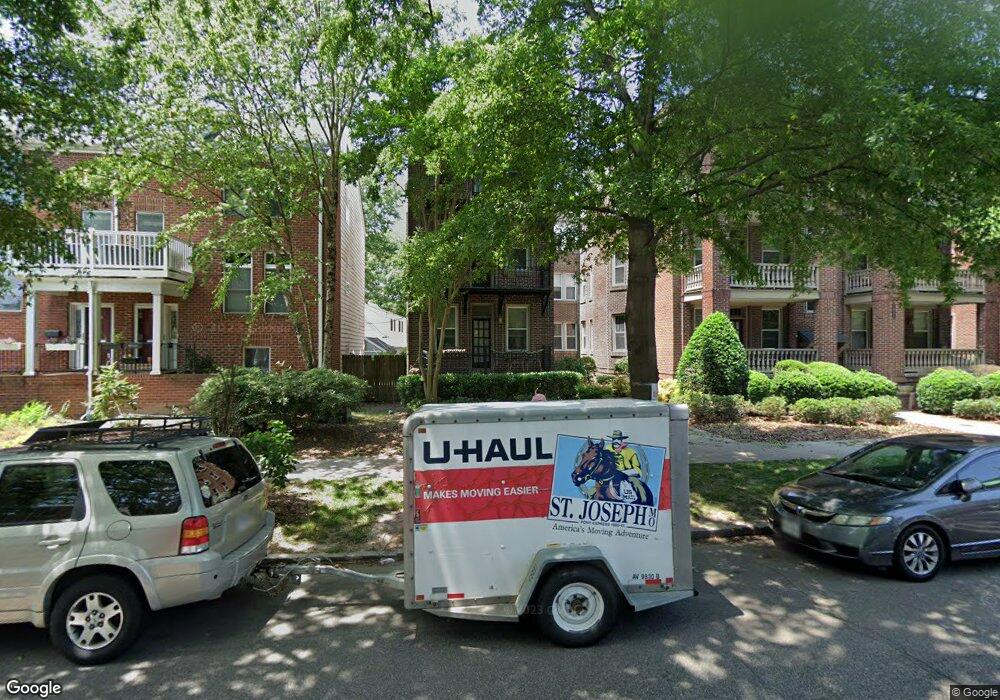
1409 Colonial Ave Unit C6 Norfolk, VA 23517
Ghent NeighborhoodEstimated Value: $184,000 - $199,000
1
Bed
1
Bath
662
Sq Ft
$292/Sq Ft
Est. Value
About This Home
This home is located at 1409 Colonial Ave Unit C6, Norfolk, VA 23517 and is currently estimated at $193,317, approximately $292 per square foot. 1409 Colonial Ave Unit C6 is a home located in Norfolk City with nearby schools including W.H. Taylor Elementary School, Blair Middle School, and Maury High School.
Ownership History
Date
Name
Owned For
Owner Type
Purchase Details
Closed on
Apr 29, 2021
Sold by
Bruggeman Paul M and Bruggeman Christine L
Bought by
Firooznia Brandon Joines
Current Estimated Value
Home Financials for this Owner
Home Financials are based on the most recent Mortgage that was taken out on this home.
Original Mortgage
$163,680
Outstanding Balance
$148,335
Interest Rate
3.1%
Mortgage Type
VA
Estimated Equity
$44,982
Purchase Details
Closed on
Oct 18, 2006
Sold by
Bonshaw Associates
Bought by
Bruggeman Paul M and Bruggeman Christine L
Home Financials for this Owner
Home Financials are based on the most recent Mortgage that was taken out on this home.
Original Mortgage
$128,000
Interest Rate
6.33%
Mortgage Type
Purchase Money Mortgage
Create a Home Valuation Report for This Property
The Home Valuation Report is an in-depth analysis detailing your home's value as well as a comparison with similar homes in the area
Home Values in the Area
Average Home Value in this Area
Purchase History
| Date | Buyer | Sale Price | Title Company |
|---|---|---|---|
| Firooznia Brandon Joines | $160,000 | Seashore Title & Settlements | |
| Bruggeman Paul M | $160,000 | -- |
Source: Public Records
Mortgage History
| Date | Status | Borrower | Loan Amount |
|---|---|---|---|
| Open | Firooznia Brandon Joines | $163,680 | |
| Previous Owner | Bruggeman Paul M | $128,000 |
Source: Public Records
Tax History Compared to Growth
Tax History
| Year | Tax Paid | Tax Assessment Tax Assessment Total Assessment is a certain percentage of the fair market value that is determined by local assessors to be the total taxable value of land and additions on the property. | Land | Improvement |
|---|---|---|---|---|
| 2025 | $2,560 | $204,800 | $34,400 | $170,400 |
| 2024 | $2,371 | $192,800 | $34,400 | $158,400 |
| 2023 | $2,250 | $180,000 | $34,400 | $145,600 |
| 2022 | $2,191 | $175,300 | $34,400 | $140,900 |
| 2021 | $2,018 | $161,400 | $34,400 | $127,000 |
| 2020 | $1,794 | $143,500 | $17,900 | $125,600 |
| 2019 | $1,721 | $137,700 | $17,900 | $119,800 |
| 2018 | $1,775 | $142,000 | $17,900 | $124,100 |
| 2017 | $1,620 | $140,900 | $17,900 | $123,000 |
| 2016 | $1,620 | $138,100 | $18,200 | $119,900 |
| 2015 | $1,588 | $138,100 | $18,200 | $119,900 |
| 2014 | $1,588 | $138,100 | $18,200 | $119,900 |
Source: Public Records
Map
Nearby Homes
- 1409 Colonial Ave Unit A4
- 1506 Colonial Ave Unit 9
- 1210 Stockley Gardens Unit 604
- 1302 Debree Ave
- 705 Spotswood Ave Unit A-6
- 1915 Colonial Ave Unit 3
- 538 Washington Park Unit B3
- 527 W 20th St Unit 404
- 1213 Botetourt Gardens
- 511 Graydon Ave Unit 3
- 1009 Colonial Ave Unit 6
- 608 Westover Ave
- 1005 Colonial Ave Unit 3
- 747 Shirley Ave
- 424 Westover Ave
- 731 W Princess Anne Rd
- 631 Westover Ave
- 800 W Princess Anne Rd Unit C6
- 819 Colonial Ave
- 812 Stockley Gardens Unit 8
- 1411 Colonial Ave Unit B4
- 1411 Colonial Ave Unit B3
- 1411 Colonial Ave Unit B2
- 1411 Colonial Ave Unit B6
- 1411 Colonial Ave Unit B1
- 1411 Colonial Ave
- 1411 Colonial Ave Unit B5
- 1409 Colonial Ave
- 1409 Colonial Ave Unit A1
- 1409 Colonial Ave Unit A2
- 1409 Colonial Ave Unit A5
- 1409 Colonial Ave Unit A3
- 1409 Colonial Ave Unit C9
- 1409 Colonial Ave Unit C8
- 1409 Colonial Ave Unit C5
- 1409 Colonial Ave Unit C3
- 1409 Colonial Ave Unit C2
- 1409 Colonial Ave Unit C7
- 1409 Colonial Ave Unit C4
- 1409 Colonial Ave Unit C1