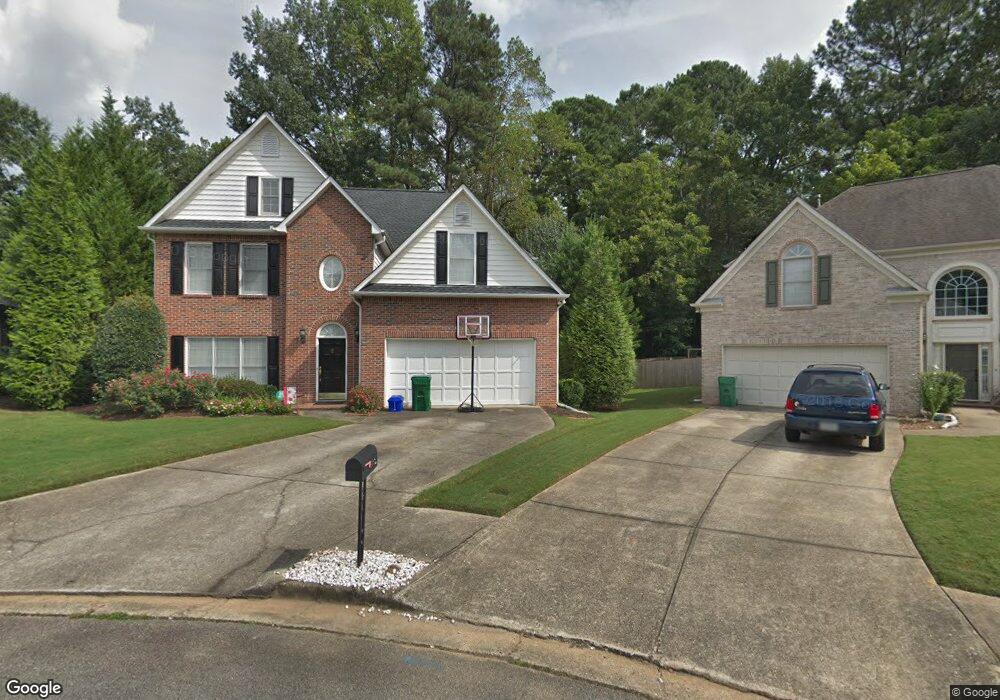
1409 Crescent Walk Decatur, GA 30033
North Druid Woods NeighborhoodEstimated Value: $594,000 - $648,000
3
Beds
3
Baths
2,447
Sq Ft
$251/Sq Ft
Est. Value
About This Home
This home is located at 1409 Crescent Walk, Decatur, GA 30033 and is currently estimated at $613,803, approximately $250 per square foot. 1409 Crescent Walk is a home located in DeKalb County with nearby schools including Laurel Ridge Elementary School, Druid Hills Middle School, and Druid Hills High School.
Ownership History
Date
Name
Owned For
Owner Type
Purchase Details
Closed on
Dec 29, 2010
Sold by
Elder Jennifer J
Bought by
Jones George W
Current Estimated Value
Purchase Details
Closed on
May 17, 2007
Sold by
Elder Jennifer J
Bought by
Elder Jennifer J and Jones George
Home Financials for this Owner
Home Financials are based on the most recent Mortgage that was taken out on this home.
Original Mortgage
$257,600
Interest Rate
6.17%
Mortgage Type
New Conventional
Purchase Details
Closed on
Sep 13, 2005
Sold by
Moosbrugger Alfred V and Moosbrugger Maureen A
Bought by
Elder Joseph T and Elder Jennifer J
Home Financials for this Owner
Home Financials are based on the most recent Mortgage that was taken out on this home.
Original Mortgage
$254,800
Interest Rate
5.86%
Mortgage Type
New Conventional
Purchase Details
Closed on
Sep 8, 1995
Sold by
Wedgewood Bldrs Inc
Bought by
Moosbrugger Alfred V
Create a Home Valuation Report for This Property
The Home Valuation Report is an in-depth analysis detailing your home's value as well as a comparison with similar homes in the area
Home Values in the Area
Average Home Value in this Area
Purchase History
| Date | Buyer | Sale Price | Title Company |
|---|---|---|---|
| Jones George W | -- | -- | |
| Elder Jennifer J | -- | -- | |
| Elder Joseph T | $318,500 | -- | |
| Moosbrugger Alfred V | $190,800 | -- |
Source: Public Records
Mortgage History
| Date | Status | Borrower | Loan Amount |
|---|---|---|---|
| Previous Owner | Elder Jennifer J | $257,600 | |
| Previous Owner | Elder Joseph T | $254,800 | |
| Closed | Moosbrugger Alfred V | $0 |
Source: Public Records
Tax History Compared to Growth
Tax History
| Year | Tax Paid | Tax Assessment Tax Assessment Total Assessment is a certain percentage of the fair market value that is determined by local assessors to be the total taxable value of land and additions on the property. | Land | Improvement |
|---|---|---|---|---|
| 2025 | $6,492 | $231,200 | $73,480 | $157,720 |
| 2024 | $5,745 | $190,000 | $73,480 | $116,520 |
| 2023 | $5,745 | $190,000 | $73,480 | $116,520 |
| 2022 | $4,716 | $193,200 | $73,480 | $119,720 |
| 2021 | $4,716 | $146,000 | $70,080 | $75,920 |
| 2020 | $4,722 | $146,000 | $70,080 | $75,920 |
| 2019 | $4,168 | $146,000 | $70,400 | $75,600 |
| 2018 | $4,183 | $134,320 | $70,400 | $63,920 |
| 2017 | $4,416 | $127,880 | $33,249 | $94,631 |
| 2016 | $4,229 | $124,560 | $32,680 | $91,880 |
| 2014 | $3,629 | $107,520 | $32,680 | $74,840 |
Source: Public Records
Map
Nearby Homes
- 1463 Crescent Walk
- 2951 Haralson Rd
- 3084 Turman Cir
- 3107 Turman Cir
- 3080 Turman Cir
- 1300 Hopkins Dr
- 1402 Mclendon Dr
- 2427 Lawrenceville Hwy Unit 4
- 3038 Flamingo Dr
- 2396 Lawrenceville Hwy Unit F
- 2396 Lawrenceville Hwy Unit V
- 2396 Lawrenceville Hwy
- 1599 Frazier Rd
- 3166 Lindmoor Dr
- 2386 Lawrenceville Hwy Unit G
- 2388 Lawrenceville Hwy Unit D
- 3119 Windfield Cir
- 3023 Mount Olive Dr
- 1413 Crescent Walk
- 3006 Haralson Rd
- 1405 Crescent Walk
- 1419 Crescent Walk
- 3014 Haralson Rd
- 1406 Crescent Walk
- 1425 Crescent Walk
- 0 Haralson Rd Unit 8743998
- 0 Haralson Rd Unit 8058804
- 0 Haralson Rd Unit 8421849
- 0 Haralson Rd Unit 7240475
- 0 Haralson Rd Unit 8055680
- 1414 Crescent Walk
- 1420 Crescent Walk
- 2999 Haralson Rd
- 3018 Haralson Rd
- 1431 Crescent Walk
- 2989 Frazier Way
- 1426 Crescent Walk
- 3011 Haralson Rd