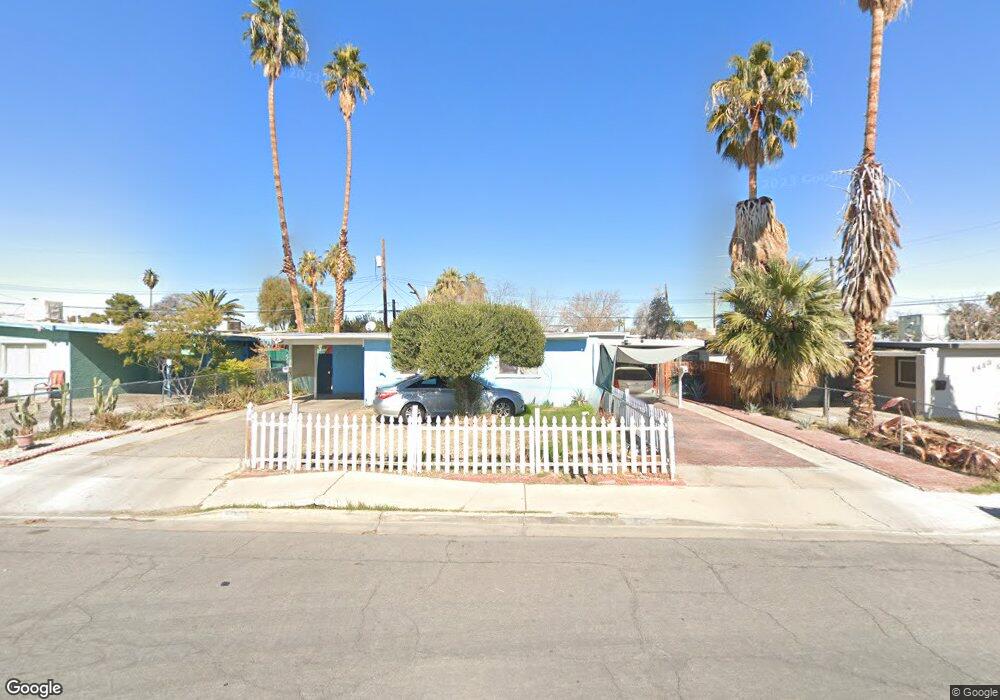
1409 Exley Ave Las Vegas, NV 89104
Huntridge NeighborhoodEstimated Value: $388,440 - $462,000
5
Beds
2
Baths
1,786
Sq Ft
$241/Sq Ft
Est. Value
About This Home
This home is located at 1409 Exley Ave, Las Vegas, NV 89104 and is currently estimated at $430,110, approximately $240 per square foot. 1409 Exley Ave is a home located in Clark County with nearby schools including Crestwood Elementary School, Roy West Martin Middle School, and Valley High School.
Ownership History
Date
Name
Owned For
Owner Type
Purchase Details
Closed on
Dec 15, 2003
Sold by
Gonzalez Veronica
Bought by
Gonzalez Valentin
Current Estimated Value
Home Financials for this Owner
Home Financials are based on the most recent Mortgage that was taken out on this home.
Original Mortgage
$137,837
Outstanding Balance
$63,768
Interest Rate
5.97%
Mortgage Type
FHA
Estimated Equity
$366,342
Purchase Details
Closed on
Nov 17, 2003
Sold by
Gonzalez Gumaro
Bought by
Gonzalez Valentin
Home Financials for this Owner
Home Financials are based on the most recent Mortgage that was taken out on this home.
Original Mortgage
$137,837
Outstanding Balance
$63,768
Interest Rate
5.97%
Mortgage Type
FHA
Estimated Equity
$366,342
Purchase Details
Closed on
Dec 24, 1997
Sold by
Peters William John and Peters Margery
Bought by
Gonzalez Gumaro
Home Financials for this Owner
Home Financials are based on the most recent Mortgage that was taken out on this home.
Original Mortgage
$95,543
Interest Rate
7.22%
Mortgage Type
FHA
Create a Home Valuation Report for This Property
The Home Valuation Report is an in-depth analysis detailing your home's value as well as a comparison with similar homes in the area
Home Values in the Area
Average Home Value in this Area
Purchase History
| Date | Buyer | Sale Price | Title Company |
|---|---|---|---|
| Gonzalez Valentin | -- | United Title Of Nevada | |
| Gonzalez Valentin | $140,000 | United Title Of Nevada | |
| Gonzalez Gumaro | $97,000 | Fidelity National Title |
Source: Public Records
Mortgage History
| Date | Status | Borrower | Loan Amount |
|---|---|---|---|
| Open | Gonzalez Valentin | $137,837 | |
| Closed | Gonzalez Gumaro | $95,543 |
Source: Public Records
Tax History Compared to Growth
Tax History
| Year | Tax Paid | Tax Assessment Tax Assessment Total Assessment is a certain percentage of the fair market value that is determined by local assessors to be the total taxable value of land and additions on the property. | Land | Improvement |
|---|---|---|---|---|
| 2025 | $1,014 | $55,872 | $34,265 | $21,607 |
| 2024 | $939 | $55,872 | $34,265 | $21,607 |
| 2023 | $939 | $53,026 | $34,300 | $18,726 |
| 2022 | $870 | $37,769 | $20,405 | $17,364 |
| 2021 | $806 | $32,047 | $18,480 | $13,567 |
| 2020 | $745 | $32,371 | $18,480 | $13,891 |
| 2019 | $698 | $29,913 | $16,450 | $13,463 |
| 2018 | $666 | $24,840 | $12,320 | $12,520 |
| 2017 | $782 | $23,850 | $11,550 | $12,300 |
| 2016 | $625 | $18,978 | $7,000 | $11,978 |
| 2015 | $622 | $18,573 | $7,000 | $11,573 |
| 2014 | $609 | $19,690 | $7,000 | $12,690 |
Source: Public Records
Map
Nearby Homes
- 1317 Exley Ave
- 2300 Pardee Place
- 1522 Exley Ave
- 1900 S 15th St
- 2409 Maroney Ave
- 1301 E Saint Louis Ave Unit C
- 1304 Bonita Ave
- 1205 Phillips Ave
- 1608 E Saint Louis Ave
- 1904 S 16th St
- 1041 E Saint Louis Ave
- 1401 E Oakey Blvd
- 2111 S Maryland Pkwy
- 1601 S Maryland Pkwy
- 1600 Becke Cir
- 1809 Lamplighter Ln
- 913 Bonita Ave
- 1405 S 11th St
- 1720 E Oakey Blvd
- 1413 S 17th St
- 1405 Exley Ave
- 1415 Exley Ave Unit 1415
- 1415 Exley Ave Unit 1413
- 1415 Exley Ave
- 1408 Phillips Ave
- 1404 Phillips Ave
- 1417 Exley Ave
- 1401 Exley Ave
- 1412 Phillips Ave
- 1414 E Phillips Ave Unit 1414
- 2201 Pardee Place
- 1400 Phillips Ave
- 1416 Phillips Ave
- 1421 Exley Ave
- 1321 Exley Ave
- 2200 Pardee Place
- 2205 Pardee Place
- 2200 S 15th St
- 1320 Phillips Ave
- 1420 Phillips Ave