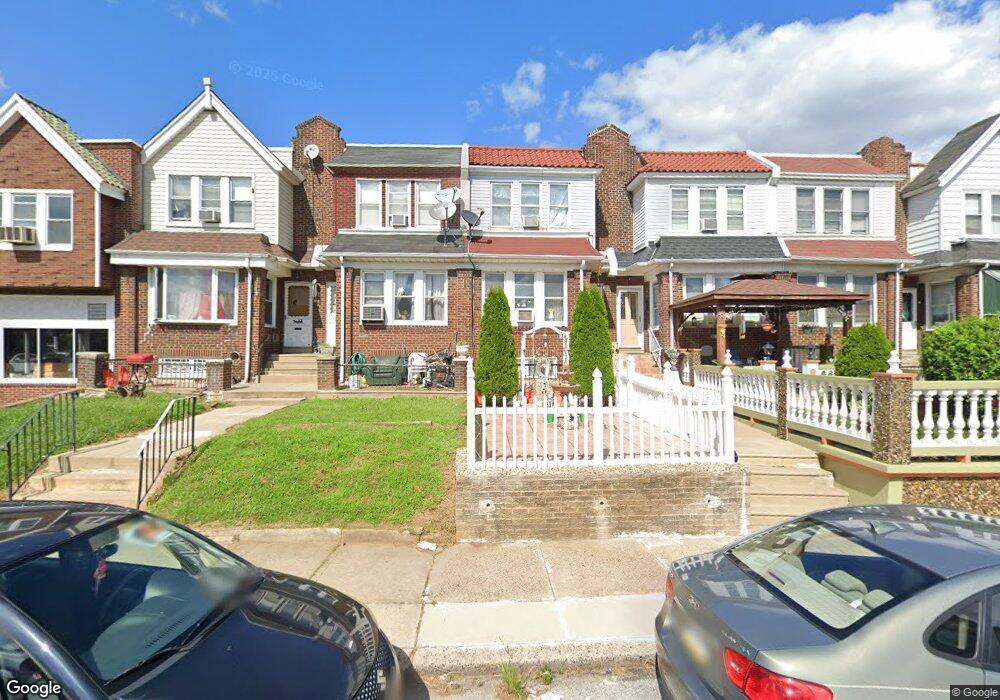
1409 Fanshawe St Philadelphia, PA 19111
Castor Gardens NeighborhoodEstimated Value: $246,000 - $256,000
3
Beds
2
Baths
1,463
Sq Ft
$172/Sq Ft
Est. Value
About This Home
This home is located at 1409 Fanshawe St, Philadelphia, PA 19111 and is currently estimated at $251,092, approximately $171 per square foot. 1409 Fanshawe St is a home located in Philadelphia County with nearby schools including J. Hampton Moore School, Castor Gardens Middle School, and Northeast High School.
Ownership History
Date
Name
Owned For
Owner Type
Purchase Details
Closed on
Jan 29, 2010
Sold by
Springer Richard J
Bought by
Carithers Paul
Current Estimated Value
Home Financials for this Owner
Home Financials are based on the most recent Mortgage that was taken out on this home.
Original Mortgage
$105,000
Outstanding Balance
$69,214
Interest Rate
4.95%
Mortgage Type
New Conventional
Estimated Equity
$181,878
Purchase Details
Closed on
Sep 15, 2009
Sold by
Us Bank National Association
Bought by
Springer Richard J
Purchase Details
Closed on
Dec 1, 2008
Sold by
Estabine Marie D
Bought by
Us Bank National Association and Pa Housing Finance Agency
Purchase Details
Closed on
Jun 30, 2006
Sold by
Oxford Circle Baptist Church
Bought by
Estabine Marie D
Home Financials for this Owner
Home Financials are based on the most recent Mortgage that was taken out on this home.
Original Mortgage
$135,800
Interest Rate
6.67%
Mortgage Type
Purchase Money Mortgage
Create a Home Valuation Report for This Property
The Home Valuation Report is an in-depth analysis detailing your home's value as well as a comparison with similar homes in the area
Home Values in the Area
Average Home Value in this Area
Purchase History
| Date | Buyer | Sale Price | Title Company |
|---|---|---|---|
| Carithers Paul | $135,000 | None Available | |
| Springer Richard J | $72,500 | None Available | |
| Us Bank National Association | $70,000 | None Available | |
| Estabine Marie D | $140,000 | None Available |
Source: Public Records
Mortgage History
| Date | Status | Borrower | Loan Amount |
|---|---|---|---|
| Open | Carithers Paul | $105,000 | |
| Previous Owner | Estabine Marie D | $135,800 |
Source: Public Records
Tax History Compared to Growth
Tax History
| Year | Tax Paid | Tax Assessment Tax Assessment Total Assessment is a certain percentage of the fair market value that is determined by local assessors to be the total taxable value of land and additions on the property. | Land | Improvement |
|---|---|---|---|---|
| 2025 | $2,447 | $222,600 | $44,520 | $178,080 |
| 2024 | $2,447 | $222,600 | $44,520 | $178,080 |
| 2023 | $2,447 | $174,800 | $34,960 | $139,840 |
| 2022 | $1,145 | $129,800 | $34,960 | $94,840 |
| 2021 | $1,775 | $0 | $0 | $0 |
| 2020 | $1,775 | $0 | $0 | $0 |
| 2019 | $1,704 | $0 | $0 | $0 |
| 2018 | $1,670 | $0 | $0 | $0 |
| 2017 | $1,670 | $0 | $0 | $0 |
| 2016 | $1,250 | $0 | $0 | $0 |
| 2015 | $1,197 | $0 | $0 | $0 |
| 2014 | -- | $119,300 | $24,528 | $94,772 |
| 2012 | -- | $15,968 | $2,297 | $13,671 |
Source: Public Records
Map
Nearby Homes
- 1425 Fanshawe St
- 1353 Fanshawe St
- 1353 Wells St
- 1417 Unruh Ave
- 1437 Magee Ave
- 1412 Magee Ave
- 1324 Unruh Ave
- 1304 Fanshawe St
- 1409 Greeby St
- 1343 Greeby St
- 1431 Greeby St
- 1344 Greeby St
- 1314 Gilham St
- 6626 Lynford St
- 1328 Greeby St
- 1326 Greeby St
- 1227 Fanshawe St
- 1238 Gilham St
- 6739 Lynford St
- 1300 Glenview St
- 1407 Fanshawe St
- 1411 Fanshawe St
- 1413 Fanshawe St
- 1405 Fanshawe St
- 1403 Fanshawe St
- 1415 Fanshawe St
- 1417 Fanshawe St
- 1419 Fanshawe St
- 1421 Fanshawe St
- 1406 Unruh Ave
- 1423 Fanshawe St
- 1408 Unruh Ave
- 1410 Unruh Ave
- 1404 Unruh Ave
- 1402 Unruh Ave
- 1412 Unruh Ave
- 1400 Unruh Ave
- 1414 Unruh Ave
- 1416 Unruh Ave
- 1427 Fanshawe St