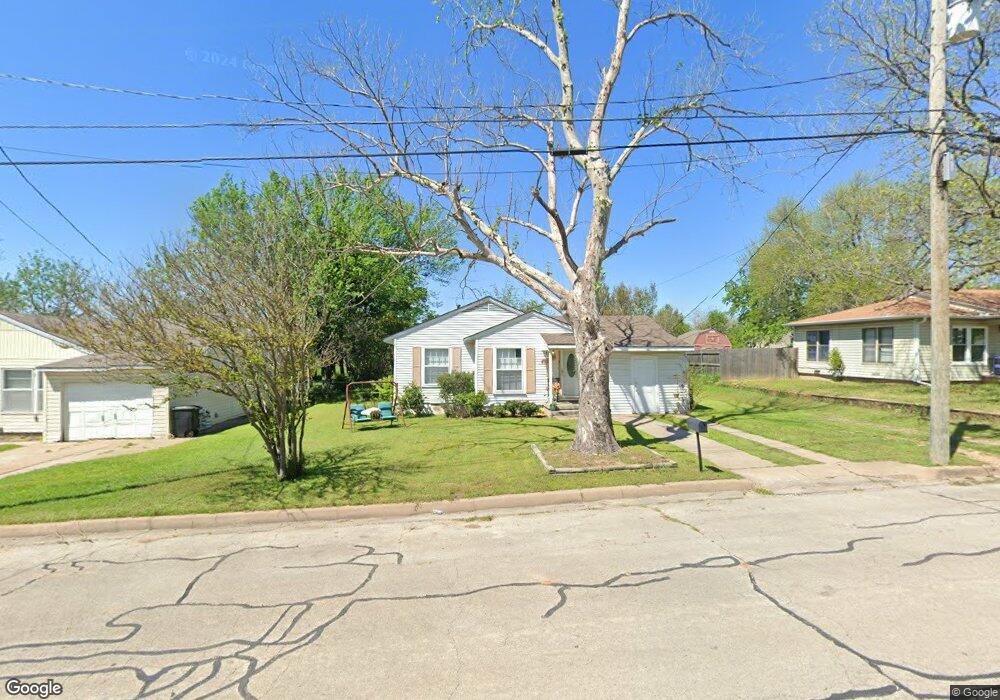
1409 Oliver St Weatherford, TX 76086
Estimated Value: $174,980 - $210,000
--
Bed
--
Bath
920
Sq Ft
$206/Sq Ft
Est. Value
About This Home
This home is located at 1409 Oliver St, Weatherford, TX 76086 and is currently estimated at $189,495, approximately $205 per square foot. 1409 Oliver St is a home located in Parker County with nearby schools including Seguin Elementary School, Tison Middle School, and Weatherford High School.
Ownership History
Date
Name
Owned For
Owner Type
Purchase Details
Closed on
Jun 14, 2019
Sold by
Hachtel Hickman Dorothy Jean and Hickman Howard Lee
Bought by
Equity Trust Company
Current Estimated Value
Purchase Details
Closed on
Nov 30, 2005
Sold by
Hachtel Dorothy J and Hachtel Dmr
Bought by
Hickman Dorothy J Hachtel and Hickman Howard L
Purchase Details
Closed on
Jan 16, 1987
Bought by
Hickman Dorothy J Hachtel and Hickman Howard L
Create a Home Valuation Report for This Property
The Home Valuation Report is an in-depth analysis detailing your home's value as well as a comparison with similar homes in the area
Home Values in the Area
Average Home Value in this Area
Purchase History
| Date | Buyer | Sale Price | Title Company |
|---|---|---|---|
| Equity Trust Company | -- | Alamo Title Company | |
| Hickman Dorothy J Hachtel | -- | -- | |
| Hachtel-Hickman Dorthy Jean | -- | None Available | |
| Hickman Dorothy J Hachtel | -- | -- |
Source: Public Records
Tax History Compared to Growth
Tax History
| Year | Tax Paid | Tax Assessment Tax Assessment Total Assessment is a certain percentage of the fair market value that is determined by local assessors to be the total taxable value of land and additions on the property. | Land | Improvement |
|---|---|---|---|---|
| 2025 | $3,074 | $173,000 | $50,000 | $123,000 |
| 2024 | $3,074 | $159,470 | $40,000 | $119,470 |
| 2023 | $3,074 | $159,470 | $40,000 | $119,470 |
| 2022 | $1,745 | $78,690 | $15,000 | $63,690 |
| 2021 | $1,890 | $78,690 | $15,000 | $63,690 |
| 2020 | $1,629 | $67,410 | $15,000 | $52,410 |
| 2019 | $1,689 | $67,410 | $15,000 | $52,410 |
| 2018 | $1,543 | $60,140 | $15,000 | $45,140 |
| 2017 | $1,457 | $60,140 | $15,000 | $45,140 |
| 2016 | $1,325 | $50,340 | $15,000 | $35,340 |
| 2015 | $928 | $50,340 | $15,000 | $35,340 |
| 2014 | $979 | $47,320 | $15,000 | $32,320 |
Source: Public Records
Map
Nearby Homes