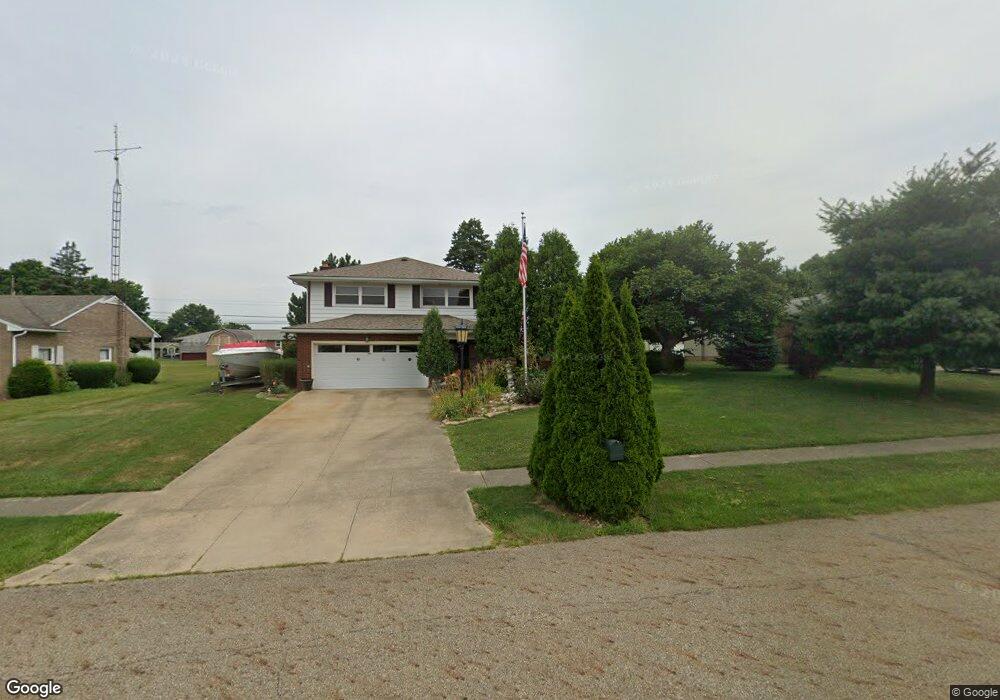
1409 Opal St Louisville, OH 44641
Estimated Value: $221,058 - $256,000
3
Beds
2
Baths
1,400
Sq Ft
$167/Sq Ft
Est. Value
About This Home
This home is located at 1409 Opal St, Louisville, OH 44641 and is currently estimated at $234,265, approximately $167 per square foot. 1409 Opal St is a home located in Stark County with nearby schools including Louisville High School.
Ownership History
Date
Name
Owned For
Owner Type
Purchase Details
Closed on
May 1, 2003
Sold by
Gleckler Mang Lois E and Mang Robert R
Bought by
Cox Gerald A and Cox Kelleen R
Current Estimated Value
Home Financials for this Owner
Home Financials are based on the most recent Mortgage that was taken out on this home.
Original Mortgage
$131,000
Outstanding Balance
$60,893
Interest Rate
6.75%
Mortgage Type
Purchase Money Mortgage
Estimated Equity
$173,372
Purchase Details
Closed on
Jul 27, 1999
Sold by
Estate Of Donald L Gleckler
Bought by
Gleckler Lois E
Purchase Details
Closed on
Sep 1, 1992
Create a Home Valuation Report for This Property
The Home Valuation Report is an in-depth analysis detailing your home's value as well as a comparison with similar homes in the area
Home Values in the Area
Average Home Value in this Area
Purchase History
| Date | Buyer | Sale Price | Title Company |
|---|---|---|---|
| Cox Gerald A | $131,000 | -- | |
| Gleckler Lois E | -- | -- | |
| -- | $86,100 | -- |
Source: Public Records
Mortgage History
| Date | Status | Borrower | Loan Amount |
|---|---|---|---|
| Open | Cox Gerald A | $131,000 |
Source: Public Records
Tax History Compared to Growth
Tax History
| Year | Tax Paid | Tax Assessment Tax Assessment Total Assessment is a certain percentage of the fair market value that is determined by local assessors to be the total taxable value of land and additions on the property. | Land | Improvement |
|---|---|---|---|---|
| 2025 | -- | $68,500 | $17,120 | $51,380 |
| 2024 | -- | $68,500 | $17,120 | $51,380 |
| 2023 | $2,643 | $61,500 | $16,140 | $45,360 |
| 2022 | $2,649 | $61,500 | $16,140 | $45,360 |
| 2021 | $2,656 | $61,500 | $16,140 | $45,360 |
| 2020 | $2,211 | $55,590 | $14,530 | $41,060 |
| 2019 | $2,220 | $55,590 | $14,530 | $41,060 |
| 2018 | $2,211 | $55,590 | $14,530 | $41,060 |
| 2017 | $2,035 | $49,360 | $12,780 | $36,580 |
| 2016 | $2,077 | $49,360 | $12,780 | $36,580 |
| 2015 | $2,083 | $49,360 | $12,780 | $36,580 |
| 2014 | $1,936 | $42,640 | $11,030 | $31,610 |
| 2013 | $971 | $42,640 | $11,030 | $31,610 |
Source: Public Records
Map
Nearby Homes
- 641 S Nickelplate St
- 1715 High St
- 520 S Silver St
- 1812 E Broad St
- 308 Superior St
- 728 E Broad St
- 2110 Edmar St
- 908 Sand Lot Cir
- 510 S Bauman Ct
- 204 E Broad St
- 0 Michigan Blvd
- 107 E Broad St
- 2015 E Main St
- 325 Lincoln Ave
- 1702 View Pointe Ave
- 3390 Meese Rd NE
- 1639 Horizon Dr
- 1170 Winding Ridge Ave
- 8225 Georgetown St
- 910 Crosswyck Cir