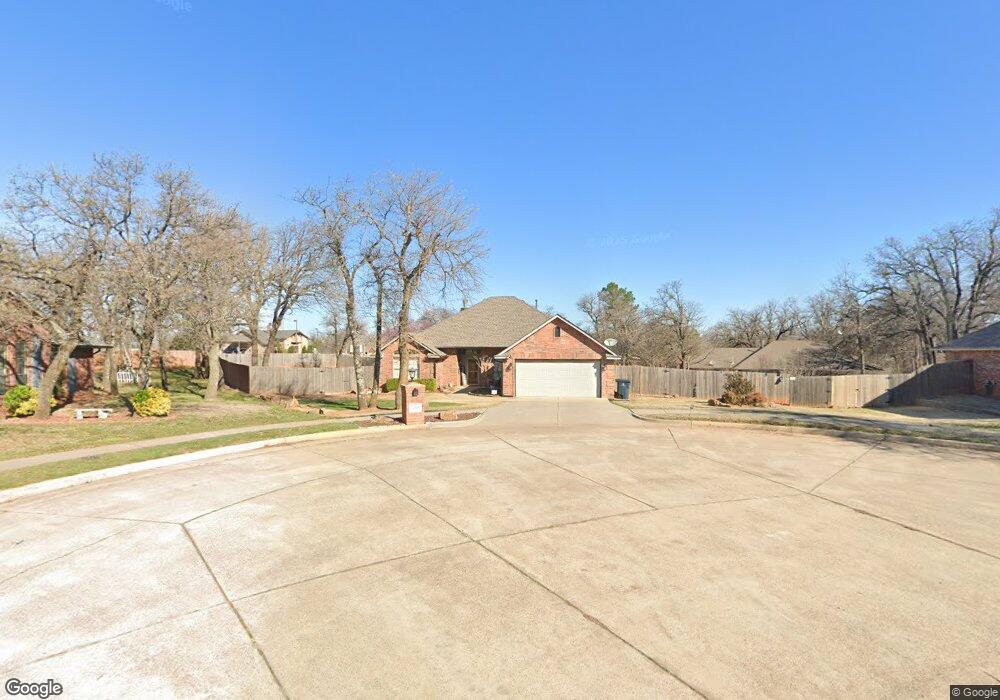
1409 Pecan Dr Blanchard, OK 73010
Estimated Value: $262,000 - $357,000
3
Beds
2
Baths
2,238
Sq Ft
$146/Sq Ft
Est. Value
About This Home
This home is located at 1409 Pecan Dr, Blanchard, OK 73010 and is currently estimated at $327,842, approximately $146 per square foot. 1409 Pecan Dr is a home located in McClain County with nearby schools including Blanchard Elementary School, Blanchard Intermediate School, and Blanchard Middle School.
Ownership History
Date
Name
Owned For
Owner Type
Purchase Details
Closed on
Sep 6, 2008
Sold by
Dees Jessie L
Bought by
Gallaher A Dean and Gallaher Tresa L
Current Estimated Value
Home Financials for this Owner
Home Financials are based on the most recent Mortgage that was taken out on this home.
Original Mortgage
$80,000
Interest Rate
6.6%
Mortgage Type
New Conventional
Purchase Details
Closed on
Jun 30, 2006
Sold by
Hutchinson Robert A and Hutchinson Mary C
Bought by
Dees Jessie L
Home Financials for this Owner
Home Financials are based on the most recent Mortgage that was taken out on this home.
Original Mortgage
$122,500
Interest Rate
6.63%
Mortgage Type
New Conventional
Purchase Details
Closed on
Sep 5, 2002
Sold by
Roy Noble Trust
Bought by
Hutchinson Robert and Hutchinson Mary
Purchase Details
Closed on
Nov 20, 2001
Sold by
Cherokee Development
Bought by
Fairview Homes
Create a Home Valuation Report for This Property
The Home Valuation Report is an in-depth analysis detailing your home's value as well as a comparison with similar homes in the area
Home Values in the Area
Average Home Value in this Area
Purchase History
| Date | Buyer | Sale Price | Title Company |
|---|---|---|---|
| Gallaher A Dean | $179,500 | None Available | |
| Dees Jessie L | $162,500 | None Available | |
| Hutchinson Robert | $152,000 | -- | |
| Fairview Homes | $20,000 | -- |
Source: Public Records
Mortgage History
| Date | Status | Borrower | Loan Amount |
|---|---|---|---|
| Closed | Gallaher A Dean | $80,000 | |
| Previous Owner | Dees Jessie L | $122,500 |
Source: Public Records
Tax History
| Year | Tax Paid | Tax Assessment Tax Assessment Total Assessment is a certain percentage of the fair market value that is determined by local assessors to be the total taxable value of land and additions on the property. | Land | Improvement |
|---|---|---|---|---|
| 2025 | $2,275 | $20,909 | $2,822 | $18,087 |
| 2024 | $2,276 | $20,910 | $2,907 | $18,003 |
| 2023 | $2,276 | $20,909 | $2,935 | $17,974 |
| 2022 | $2,280 | $20,910 | $2,282 | $18,628 |
| 2021 | $2,282 | $20,910 | $2,282 | $18,628 |
| 2020 | $2,592 | $20,910 | $2,282 | $18,628 |
| 2019 | $2,640 | $20,909 | $2,750 | $18,159 |
| 2018 | $2,404 | $20,909 | $2,750 | $18,159 |
| 2017 | $2,624 | $20,909 | $2,750 | $18,159 |
| 2016 | $2,377 | $20,301 | $2,750 | $17,551 |
| 2015 | $2,356 | $19,709 | $2,750 | $16,959 |
| 2014 | $2,342 | $19,135 | $2,750 | $16,385 |
Source: Public Records
Map
Nearby Homes
- 1403 Pecan Dr
- 1605 Silver Oak Dr
- 1705 Maple Dr
- 1133 Wild Rye Ct
- 299 Megan Ct
- 23801 Oklahoma 76
- 304 Cherokee Ct
- 1101 Parrish Place
- 1692 Appaloosa Dr
- 2435 Heather Rd
- 254 Megan Ct
- 300 Bailey St
- 1116 Cedar Dr
- 1858 N Main
- 255 Megan Ct
- 2116 Emily Rae Ln
- 611 N Van Buren Ave
- 1786 Doc Bar Ave
- 516 N Van Buren Ave
- 1832 Buckskin Ct
- 1407 Pecan Dr
- 516 Oak Ridge Place
- 1405 Pecan Dr
- 1106 Oak Ridge Place
- 1406 Pecan Dr
- 603 Mulberry
- 1404 Pecan Dr
- 523 Mulberry
- 509 Oak Ridge Place
- 421 Sill Cir
- 2900 Charlottes Way
- 2940 Charlottes Way
- 2893 Valley View Ln
- 2892 Valley View Ln
- 6000 Ward Acres Rd
- 2910 Charlottes Way
- 2820 Charlottes Way
- 2841 Valley View Ln
- 2945 Upper Abby Ct
- 2911 Charlottes Way
Your Personal Tour Guide
Ask me questions while you tour the home.