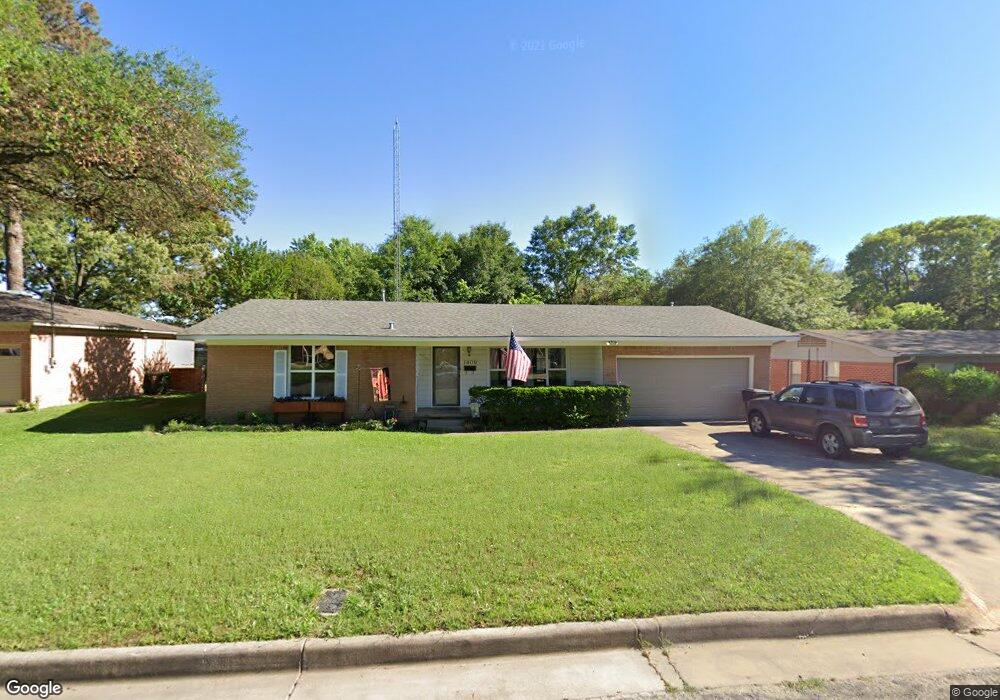
1409 Pettit Dr Tyler, TX 75701
Green Acres NeighborhoodEstimated Value: $187,000 - $231,000
--
Bed
3
Baths
1,404
Sq Ft
$150/Sq Ft
Est. Value
About This Home
This home is located at 1409 Pettit Dr, Tyler, TX 75701 and is currently estimated at $210,810, approximately $150 per square foot. 1409 Pettit Dr is a home located in Smith County with nearby schools including Woods Elementary School, Hubbard Middle School, and Tyler Legacy High School.
Ownership History
Date
Name
Owned For
Owner Type
Purchase Details
Closed on
Dec 18, 2020
Sold by
Moss Thomas T
Bought by
Pcs Realty Partners Ltd
Current Estimated Value
Purchase Details
Closed on
May 21, 2009
Sold by
Deutsche Bank National Trust Company
Bought by
Moss Thomas T
Home Financials for this Owner
Home Financials are based on the most recent Mortgage that was taken out on this home.
Original Mortgage
$69,350
Interest Rate
4.84%
Mortgage Type
Purchase Money Mortgage
Purchase Details
Closed on
Oct 19, 2005
Sold by
Sellers Larry Michael and Sellers Linda Kay
Bought by
Chalk Gregory and Chalk Angela
Home Financials for this Owner
Home Financials are based on the most recent Mortgage that was taken out on this home.
Original Mortgage
$92,700
Interest Rate
8.05%
Mortgage Type
Adjustable Rate Mortgage/ARM
Create a Home Valuation Report for This Property
The Home Valuation Report is an in-depth analysis detailing your home's value as well as a comparison with similar homes in the area
Home Values in the Area
Average Home Value in this Area
Purchase History
| Date | Buyer | Sale Price | Title Company |
|---|---|---|---|
| Pcs Realty Partners Ltd | -- | None Available | |
| Moss Thomas T | -- | Lsi Title Agency Inc | |
| Moss Thomas T | -- | Lsi Title Agency Inc | |
| Chalk Gregory | -- | None Available | |
| Chalk Gregory | -- | None Available |
Source: Public Records
Mortgage History
| Date | Status | Borrower | Loan Amount |
|---|---|---|---|
| Previous Owner | Moss Thomas T | $69,350 | |
| Previous Owner | Chalk Gregory | $92,700 |
Source: Public Records
Tax History Compared to Growth
Tax History
| Year | Tax Paid | Tax Assessment Tax Assessment Total Assessment is a certain percentage of the fair market value that is determined by local assessors to be the total taxable value of land and additions on the property. | Land | Improvement |
|---|---|---|---|---|
| 2025 | $3,128 | $184,968 | $32,610 | $152,358 |
| 2024 | $3,128 | $183,854 | $28,440 | $155,414 |
| 2023 | $2,764 | $158,534 | $28,440 | $130,094 |
| 2022 | $2,628 | $134,134 | $23,700 | $110,434 |
| 2021 | $2,027 | $96,624 | $23,700 | $72,924 |
| 2020 | $2,035 | $95,115 | $23,700 | $71,415 |
| 2019 | $1,958 | $89,559 | $18,960 | $70,599 |
| 2018 | $1,899 | $87,317 | $18,960 | $68,357 |
| 2017 | $1,988 | $93,111 | $18,960 | $74,151 |
| 2016 | $1,817 | $85,108 | $18,960 | $66,148 |
| 2015 | $1,459 | $80,808 | $18,960 | $61,848 |
| 2014 | $1,459 | $79,171 | $18,960 | $60,211 |
Source: Public Records
Map
Nearby Homes
- 1505 Glenrose St
- 3523 S Cameron Ave
- 4211 Birdwell Dr
- 3400 Birdwell Dr
- 1408 Westfield St
- 3809 Arlington Ave
- 1720 Kimwood Ln
- 1107 Pinedale Place
- 1608 Yosemite Dr
- 3235 Curtis Dr
- 1807 Kimwood Ln
- 1113 E Amherst Dr
- 3215 Curtis Dr
- 3710 Bain Place
- 3511 S Keaton Ave
- 4021 New Copeland Rd
- 3110 Curtis Dr
- 1018 Pollard Dr
- 3712 Colony Park Dr
- 2006 Villa Dr