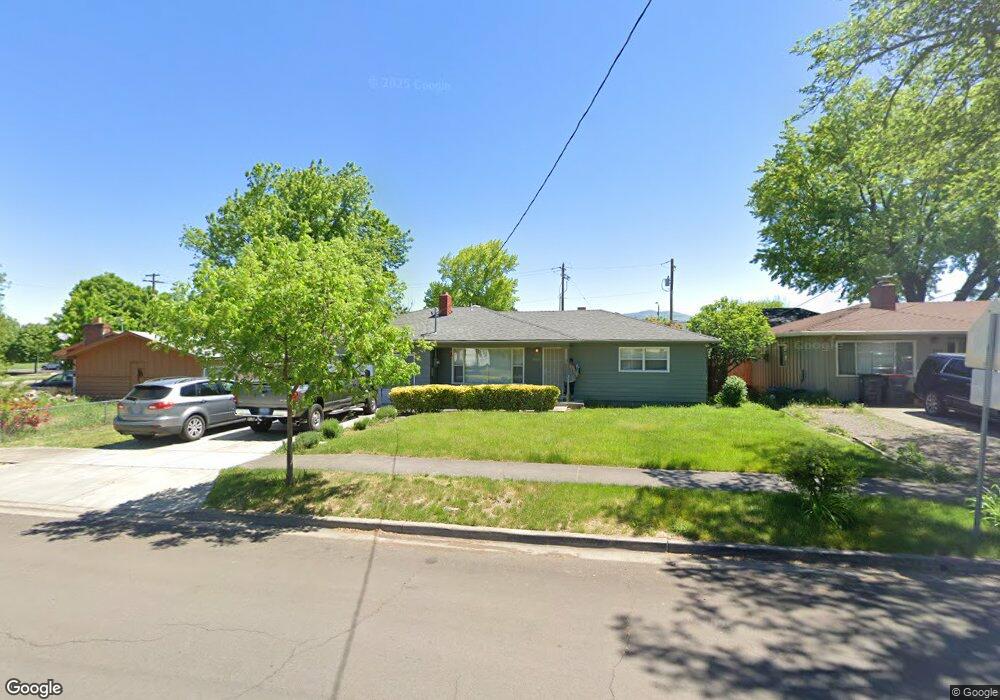
1409 S Ivy St Medford, OR 97501
Southwest Medford NeighborhoodEstimated Value: $318,000 - $368,000
2
Beds
2
Baths
1,116
Sq Ft
$299/Sq Ft
Est. Value
About This Home
This home is located at 1409 S Ivy St, Medford, OR 97501 and is currently estimated at $333,663, approximately $298 per square foot. 1409 S Ivy St is a home located in Jackson County with nearby schools including Jefferson Elementary School, McLoughlin Middle School, and South Medford High School.
Ownership History
Date
Name
Owned For
Owner Type
Purchase Details
Closed on
Feb 22, 2019
Sold by
Benth Rogers Patrick and Benth Van Groningen Susan
Bought by
Baill Donald
Current Estimated Value
Home Financials for this Owner
Home Financials are based on the most recent Mortgage that was taken out on this home.
Original Mortgage
$202,000
Outstanding Balance
$177,232
Interest Rate
4.4%
Mortgage Type
VA
Estimated Equity
$156,431
Purchase Details
Closed on
Feb 21, 2017
Sold by
Rogers Patrick
Bought by
Rogers Patrick and Rogers Van Groningen
Purchase Details
Closed on
Nov 11, 2011
Sold by
Lopez Jones Tammey
Bought by
Rogers Patrick
Home Financials for this Owner
Home Financials are based on the most recent Mortgage that was taken out on this home.
Original Mortgage
$111,564
Interest Rate
3.95%
Mortgage Type
VA
Create a Home Valuation Report for This Property
The Home Valuation Report is an in-depth analysis detailing your home's value as well as a comparison with similar homes in the area
Home Values in the Area
Average Home Value in this Area
Purchase History
| Date | Buyer | Sale Price | Title Company |
|---|---|---|---|
| Baill Donald | $210,000 | Ticor Title | |
| Rogers Patrick | -- | Ticor Title Company Of Or | |
| Rogers Patrick | $108,000 | Ticor Title |
Source: Public Records
Mortgage History
| Date | Status | Borrower | Loan Amount |
|---|---|---|---|
| Open | Baill Donald | $202,000 | |
| Previous Owner | Rogers Patrick | $111,564 |
Source: Public Records
Tax History Compared to Growth
Tax History
| Year | Tax Paid | Tax Assessment Tax Assessment Total Assessment is a certain percentage of the fair market value that is determined by local assessors to be the total taxable value of land and additions on the property. | Land | Improvement |
|---|---|---|---|---|
| 2025 | $2,291 | $157,940 | $67,460 | $90,480 |
| 2024 | $2,291 | $153,340 | $65,490 | $87,850 |
| 2023 | $2,220 | $148,880 | $63,590 | $85,290 |
| 2022 | $2,166 | $148,880 | $63,590 | $85,290 |
| 2021 | $2,110 | $144,550 | $61,740 | $82,810 |
| 2020 | $2,066 | $140,340 | $59,940 | $80,400 |
| 2019 | $2,017 | $132,300 | $56,500 | $75,800 |
| 2018 | $1,965 | $128,450 | $54,850 | $73,600 |
| 2017 | $1,930 | $128,450 | $54,850 | $73,600 |
| 2016 | $1,943 | $121,080 | $51,700 | $69,380 |
| 2015 | $1,867 | $121,080 | $51,700 | $69,380 |
| 2014 | $1,834 | $114,140 | $48,730 | $65,410 |
Source: Public Records
Map
Nearby Homes
- 1548 S Ivy St
- 1430 S Oakdale Ave
- 372 Ogara St
- 1752 Sandpiper Dr
- 633 Aspen St
- 1108 S Oakdale Ave
- 937 Kenyon St
- 923 Jasper St
- 921 S Holly St
- 912 S Holly St
- 0 Garfield St Unit 220210927
- 909 S Holly St
- 730 Aspen St
- 917 Grant Ave
- 607 Catherine St
- 1687 Lillian St
- 0 E Stewart Ave
- 801 Grant Ave
- 871 Marshall Ave
- 0 Beekman Unit 1288