1409 Shaws Ln Ottawa, IL 61350
Estimated Value: $381,316 - $442,000
About This Home
This home is located at 1409 Shaws Ln, Ottawa, IL 61350 and is currently estimated at $408,579, approximately $190 per square foot. 1409 Shaws Ln is a home located in LaSalle County with nearby schools including Ottawa Township High School, Marquette Academy, and Ottawa Christian Academy.
Ownership History
We collect this data history from publicly available records. To have your information removed, we recommend requesting removal directly through your county’s website.
Purchase Details
Home Financials for this Owner
Home Financials are based on the most recent Mortgage that was taken out on this home.Purchase Details
Home Financials for this Owner
Home Financials are based on the most recent Mortgage that was taken out on this home.Home Values in the Area
Average Home Value in this Area
Purchase History
We collect this data history from publicly available records. To have your information removed, we recommend requesting removal directly through your county’s website.
| Date | Buyer | Sale Price | Title Company |
|---|---|---|---|
| $231,800 | None Available | ||
| $419,000 | None Available |
Mortgage History
We collect this data history from publicly available records. To have your information removed, we recommend requesting removal directly through your county’s website.
| Date | Status | Borrower | Loan Amount |
|---|---|---|---|
| Closed | $131,800 | ||
| Previous Owner | $150,000 |
Tax History
We collect this data history from publicly available records. To have your information removed, we recommend requesting removal directly through your county’s website.
| Year | Tax Paid | Tax Assessment Tax Assessment Total Assessment is a certain percentage of the fair market value that is determined by local assessors to be the total taxable value of land and additions on the property. | Land | Improvement |
|---|---|---|---|---|
| 2025 | $9,918 | $116,038 | $16,980 | $99,058 |
| 2024 | $9,918 | $106,948 | $15,650 | $91,298 |
| 2023 | $7,730 | $98,352 | $14,392 | $83,960 |
| 2022 | $7,827 | $89,795 | $14,159 | $75,636 |
| 2021 | $7,225 | $84,188 | $13,275 | $70,913 |
| 2020 | $6,797 | $80,270 | $12,657 | $67,613 |
| 2019 | $6,778 | $77,856 | $12,276 | $65,580 |
| 2018 | $6,569 | $75,869 | $11,963 | $63,906 |
| 2017 | $7,117 | $70,627 | $11,703 | $58,924 |
| 2016 | $6,864 | $68,107 | $11,285 | $56,822 |
| 2015 | $6,521 | $65,180 | $10,800 | $54,380 |
| 2012 | -- | $66,451 | $11,011 | $55,440 |
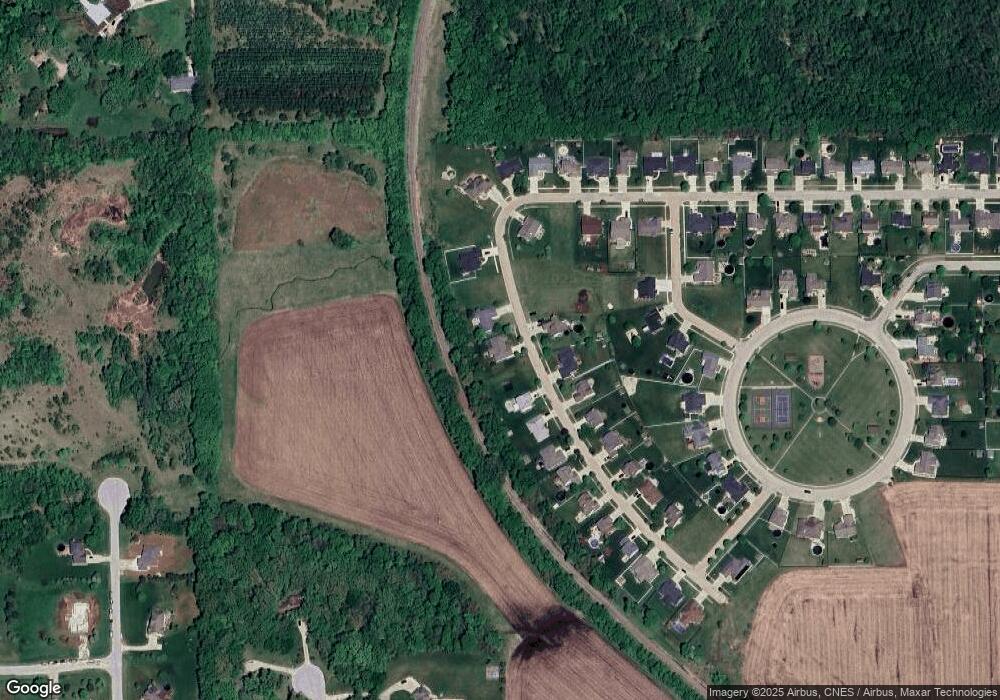
Map
- 1422 Shaws Ln
- 1401 Shaws Ln
- 1402 Shaws Ln
- 1405 Shaws Ln
- 1249 Tower Dr
- 2669 E 1545 Rd
- 1414 Pembrook Ln
- 1410 Pembrook Ln
- 1522 Illinois 71
- 1000 W Mckinley Rd
- 1100 Wacker Dr
- 1123 Country Oak Dr
- 921 4h Rd
- 817 Adrienne Ave
- 905 Knottingham Dr
- 1002 Thornberry Ct
- 808 Kimberly Ln
- 309 19th Ave
- 415 Thompson St
- 305 Thompson St
Ask me questions while you tour the home.