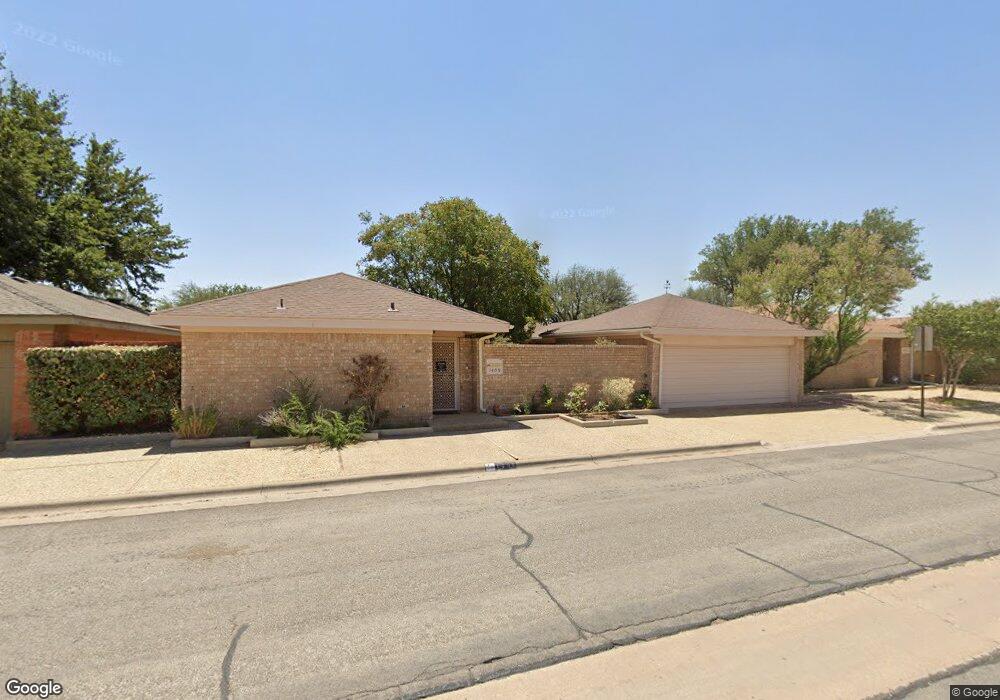
1409 Ventura Ave Midland, TX 79705
Estimated Value: $319,000 - $452,000
3
Beds
2
Baths
2,428
Sq Ft
$155/Sq Ft
Est. Value
About This Home
This home is located at 1409 Ventura Ave, Midland, TX 79705 and is currently estimated at $376,607, approximately $155 per square foot. 1409 Ventura Ave is a home located in Midland County with nearby schools including Fannin Elementary School, Midland High School, and Milam Elementary School.
Ownership History
Date
Name
Owned For
Owner Type
Purchase Details
Closed on
Jul 25, 2019
Sold by
Franklin Jon Harold
Bought by
Franklin Jon H and Franklin Lorraine D
Current Estimated Value
Purchase Details
Closed on
Aug 12, 2016
Sold by
Short Wana Lynn and Franklin Jon H
Bought by
Clark Wana Milam
Purchase Details
Closed on
Jun 20, 2008
Sold by
Clark Wana Milam
Bought by
Clark Wana Milam
Home Financials for this Owner
Home Financials are based on the most recent Mortgage that was taken out on this home.
Original Mortgage
$100,500
Interest Rate
6.11%
Mortgage Type
Stand Alone Refi Refinance Of Original Loan
Purchase Details
Closed on
Apr 2, 2001
Sold by
Bristol C P
Bought by
Clark Wana Milam
Purchase Details
Closed on
May 3, 1973
Bought by
Clark Wana Milam
Create a Home Valuation Report for This Property
The Home Valuation Report is an in-depth analysis detailing your home's value as well as a comparison with similar homes in the area
Home Values in the Area
Average Home Value in this Area
Purchase History
| Date | Buyer | Sale Price | Title Company |
|---|---|---|---|
| Franklin Jon H | -- | None Available | |
| Clark Wana Milam | -- | Lone Star Abstract & Title C | |
| Clark Wana Milam | -- | First American Title Ins Co | |
| Clark Wana Milam | -- | -- | |
| Clark Wana Milam | -- | -- |
Source: Public Records
Mortgage History
| Date | Status | Borrower | Loan Amount |
|---|---|---|---|
| Previous Owner | Clark Wana Milam | $100,500 |
Source: Public Records
Tax History Compared to Growth
Tax History
| Year | Tax Paid | Tax Assessment Tax Assessment Total Assessment is a certain percentage of the fair market value that is determined by local assessors to be the total taxable value of land and additions on the property. | Land | Improvement |
|---|---|---|---|---|
| 2025 | $4,199 | $271,040 | $19,420 | $251,620 |
| 2024 | $4,205 | $276,890 | $19,420 | $257,470 |
| 2023 | $4,075 | $271,910 | $19,420 | $252,490 |
| 2022 | $4,193 | $268,370 | $19,420 | $248,950 |
| 2021 | $4,597 | $263,850 | $19,420 | $244,430 |
| 2020 | $4,477 | $262,420 | $19,420 | $243,000 |
| 2019 | $4,874 | $257,470 | $19,420 | $243,000 |
| 2018 | $4,551 | $234,060 | $19,420 | $214,640 |
| 2017 | $4,296 | $220,960 | $19,420 | $201,540 |
| 2016 | $4,072 | $217,030 | $19,420 | $197,610 |
| 2015 | -- | $217,030 | $19,420 | $197,610 |
| 2014 | -- | $216,720 | $0 | $0 |
Source: Public Records
Map
Nearby Homes
- 1209 W Pecan Ave
- 907 Shirley Ct
- 2202 Western Dr
- 2109 Western Dr
- 2105 Oaklawn Dr
- 1611 W Pecan Ave
- 806 Stanolind Ave
- 2704 N L St
- 6 Lafayette Place
- 2000 Neely Ave
- 2207 Raleigh Point Dr
- 1200 W Scharbauer Dr
- 2609 Mcclintic St
- 1202 W Scharbauer Dr
- 1210 W Scharbauer Dr
- 2016 Gulf Prairie Ln
- 1602 Winfield Rd
- 7 Lafayette Place
- 1805 N D St
- 716 Melton Alley
- 1411 Ventura Ave
- 1407 Ventura Ave
- 1406 W Pine Ave
- 1404 W Pine Ave
- 1408 W Pine Ave
- 1413 Ventura Ave
- 1405 Ventura Ave
- 1402 W Pine Ave
- 1410 W Pine Ave
- 1415 Ventura Ave
- 1403 Ventura Ave
- 1403 W Pine Ave
- 1401 W Pine Ave
- 1412 W Pine Ave
- 1405 W Pine Ave
- 1400 W Pine Ave
- 1417 Ventura Ave
- 1407 W Pine Ave
- 1401 Ventura Ave
- 1414 W Pine Ave