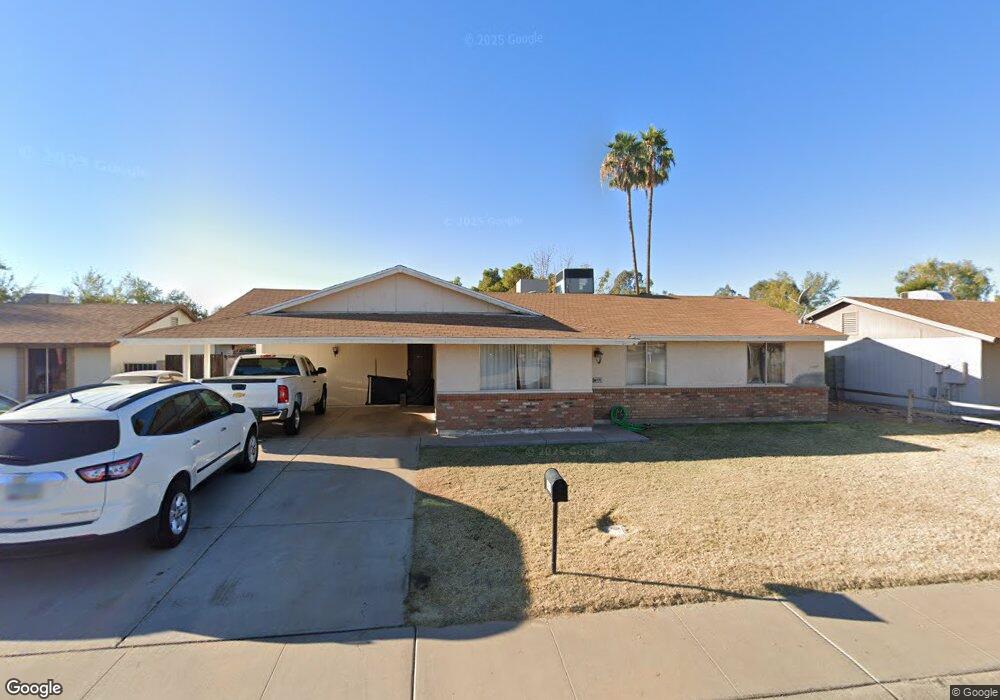
1409 W Los Arboles Place Chandler, AZ 85224
Amberwood NeighborhoodEstimated Value: $363,829 - $501,000
--
Bed
2
Baths
1,500
Sq Ft
$303/Sq Ft
Est. Value
About This Home
This home is located at 1409 W Los Arboles Place, Chandler, AZ 85224 and is currently estimated at $454,957, approximately $303 per square foot. 1409 W Los Arboles Place is a home located in Maricopa County with nearby schools including Pomeroy Elementary School, Franklin at Brimhall Elementary School, and Summit Academy Elementary.
Ownership History
Date
Name
Owned For
Owner Type
Purchase Details
Closed on
Mar 22, 2024
Sold by
Castro Frank and Castro Cindy
Bought by
Castro Family Trust and Castro
Current Estimated Value
Purchase Details
Closed on
Nov 17, 2003
Sold by
Castro Cindy
Bought by
Castro Frank and Castro Cindy
Home Financials for this Owner
Home Financials are based on the most recent Mortgage that was taken out on this home.
Original Mortgage
$88,000
Interest Rate
5.89%
Mortgage Type
Purchase Money Mortgage
Purchase Details
Closed on
Oct 17, 2003
Sold by
Castro Frank and Castro Cindy
Bought by
Castro Cindy
Home Financials for this Owner
Home Financials are based on the most recent Mortgage that was taken out on this home.
Original Mortgage
$88,000
Interest Rate
5.89%
Mortgage Type
Purchase Money Mortgage
Create a Home Valuation Report for This Property
The Home Valuation Report is an in-depth analysis detailing your home's value as well as a comparison with similar homes in the area
Home Values in the Area
Average Home Value in this Area
Purchase History
| Date | Buyer | Sale Price | Title Company |
|---|---|---|---|
| Castro Family Trust | -- | None Listed On Document | |
| Castro Frank | -- | Capital Title Agency Inc | |
| Castro Cindy | -- | Capital Title Agency Inc |
Source: Public Records
Mortgage History
| Date | Status | Borrower | Loan Amount |
|---|---|---|---|
| Previous Owner | Castro Cindy | $88,000 |
Source: Public Records
Tax History Compared to Growth
Tax History
| Year | Tax Paid | Tax Assessment Tax Assessment Total Assessment is a certain percentage of the fair market value that is determined by local assessors to be the total taxable value of land and additions on the property. | Land | Improvement |
|---|---|---|---|---|
| 2025 | $1,303 | $15,277 | -- | -- |
| 2024 | $1,315 | $14,549 | -- | -- |
| 2023 | $1,315 | $33,010 | $6,600 | $26,410 |
| 2022 | $1,279 | $24,720 | $4,940 | $19,780 |
| 2021 | $1,286 | $21,730 | $4,340 | $17,390 |
| 2020 | $1,272 | $19,880 | $3,970 | $15,910 |
| 2019 | $1,171 | $18,150 | $3,630 | $14,520 |
| 2018 | $1,138 | $16,470 | $3,290 | $13,180 |
| 2017 | $1,094 | $15,230 | $3,040 | $12,190 |
| 2016 | $1,070 | $14,380 | $2,870 | $11,510 |
| 2015 | $1,007 | $14,060 | $2,810 | $11,250 |
Source: Public Records
Map
Nearby Homes
- 1403 W Los Arboles Place
- 1417 W Los Arboles Place
- 1913 N Verano Way
- 2201 N Comanche Dr Unit 1080
- 2201 N Comanche Dr Unit 1104
- 2201 N Comanche Dr Unit 1018
- 2201 N Comanche Dr Unit 1002
- 2104 N Pennington Dr
- 1214 W Estrella Dr
- 1511 W Mesquite St
- 1224 W Mesquite St
- 2015 N Villas Ln
- 2129 N Villas Ln
- 1645 N Saguaro St
- 1624 N Calle Cir
- 1714 N Pleasant Dr
- 1621 N Longmore St
- 1704 W Rosal Dr
- 1771 W Mariposa Ct
- 1621 N Chippewa Dr
- 1407 W Los Arboles Place
- 1411 W Los Arboles Place
- 1405 W Los Arboles Place
- 1413 W Los Arboles Place
- 2001 N Los Arboles Ct
- 2000 N Los Arboles Ct
- 1415 W Los Arboles Place
- 2003 N Los Arboles Ct
- 1406 W Los Arboles Place
- 1401 W Los Arboles Place
- 2004 N Central Dr
- 2002 N Los Arboles Ct
- 2005 N Los Arboles Ct
- 2006 N Central Dr
- 1328 W Brooks St
- 2004 N Los Arboles Ct
- 2007 N Los Arboles Ct
- 1419 W Los Arboles Place
- 1408 W Los Arboles Place
- 2302 N Los Arboles Place