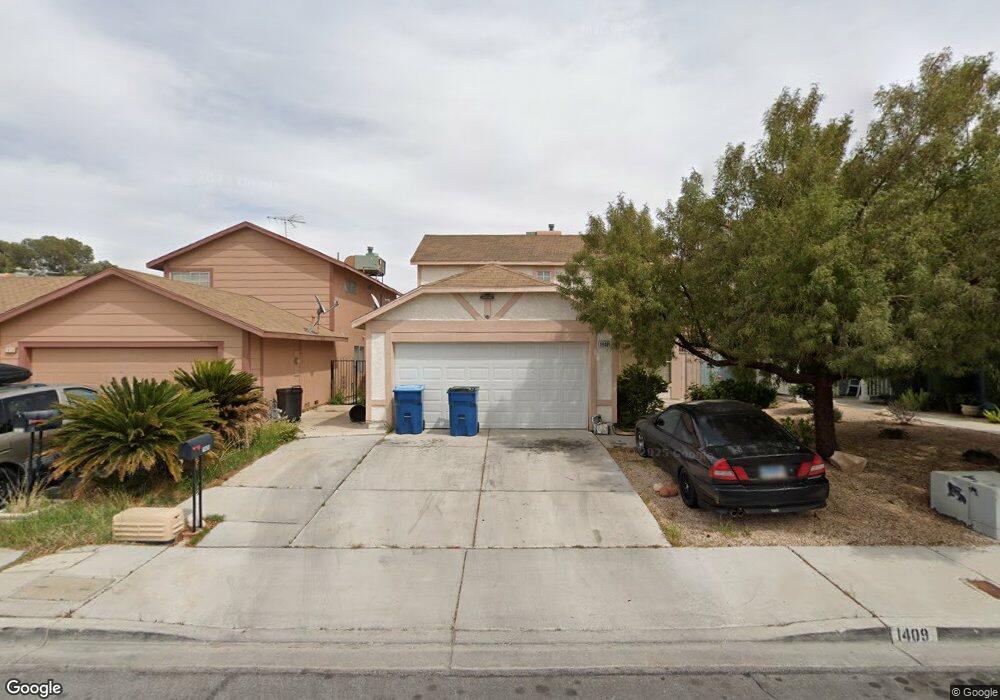
1409 Wheatland Way Unit none Las Vegas, NV 89128
Pioneer Park NeighborhoodEstimated Value: $366,422 - $401,000
3
Beds
3
Baths
1,504
Sq Ft
$252/Sq Ft
Est. Value
About This Home
This home is located at 1409 Wheatland Way Unit none, Las Vegas, NV 89128 and is currently estimated at $379,606, approximately $252 per square foot. 1409 Wheatland Way Unit none is a home located in Clark County with nearby schools including James B. McMillan Elementary School, Edythe & Lloyd Katz Elementary School, and Ernest Becker Middle School.
Ownership History
Date
Name
Owned For
Owner Type
Purchase Details
Closed on
Jul 2, 2019
Sold by
Quintero Maria C
Bought by
Quintero Maria Cristina and M A Q Trust
Current Estimated Value
Purchase Details
Closed on
Aug 14, 2012
Sold by
Lobster 777 Llc
Bought by
Quintero Maria C
Home Financials for this Owner
Home Financials are based on the most recent Mortgage that was taken out on this home.
Original Mortgage
$80,000
Outstanding Balance
$54,815
Interest Rate
3.59%
Mortgage Type
Unknown
Estimated Equity
$324,791
Purchase Details
Closed on
Apr 4, 2012
Sold by
Heacock Jimmy David Genaro
Bought by
Lobster 777 Llc
Purchase Details
Closed on
Mar 5, 2003
Sold by
Heacock Jimmy D and Heacock Maryloe
Bought by
Genaro Jimmy David
Create a Home Valuation Report for This Property
The Home Valuation Report is an in-depth analysis detailing your home's value as well as a comparison with similar homes in the area
Home Values in the Area
Average Home Value in this Area
Purchase History
| Date | Buyer | Sale Price | Title Company |
|---|---|---|---|
| Quintero Maria Cristina | -- | None Available | |
| Quintero Maria C | $110,000 | Noble Title | |
| Lobster 777 Llc | $72,260 | None Available | |
| Genaro Jimmy David | -- | -- |
Source: Public Records
Mortgage History
| Date | Status | Borrower | Loan Amount |
|---|---|---|---|
| Open | Quintero Maria C | $80,000 |
Source: Public Records
Tax History Compared to Growth
Tax History
| Year | Tax Paid | Tax Assessment Tax Assessment Total Assessment is a certain percentage of the fair market value that is determined by local assessors to be the total taxable value of land and additions on the property. | Land | Improvement |
|---|---|---|---|---|
| 2025 | $1,191 | $64,449 | $29,750 | $34,699 |
| 2024 | $1,157 | $64,449 | $29,750 | $34,699 |
| 2023 | $885 | $62,067 | $28,350 | $33,717 |
| 2022 | $1,232 | $53,995 | $22,750 | $31,245 |
| 2021 | $1,141 | $50,764 | $20,650 | $30,114 |
| 2020 | $1,056 | $50,177 | $19,950 | $30,227 |
| 2019 | $990 | $46,513 | $16,450 | $30,063 |
| 2018 | $945 | $44,194 | $15,050 | $29,144 |
| 2017 | $1,437 | $43,838 | $14,000 | $29,838 |
| 2016 | $885 | $40,158 | $9,800 | $30,358 |
| 2015 | $883 | $37,780 | $8,750 | $29,030 |
| 2014 | $855 | $27,114 | $5,250 | $21,864 |
Source: Public Records
Map
Nearby Homes
- 7037 Brown Derby Cir
- 1533 Wintergreen Dr
- 1320 Rainbow Meadows Dr
- 7104 Carmen Blvd
- 7224 Single Pine Dr
- 7228 Single Pine Dr
- 1624 Leaning Pine Way
- 7113 Carrondale Way
- 7405 Saybrook Point Dr
- 1636 Royal Palm Dr
- 1605 Palmales Ct
- 7321 Summer Sun Dr
- 1620 Palmae Way
- 1009 Pagosa Way
- 1105 Olvera Way
- 925 Willow Tree Dr Unit B
- 1009 Willow Tree Dr Unit C
- 1028 Willow Tree Dr Unit D
- 7400 Queen Palm Dr
- 1017 Willow Tree Dr Unit C
- 1409 Wheatland Way
- 1413 Wheatland Way
- 1405 Wheatland Way
- 1417 Wheatland Way
- 7225 Bronze Cir
- 1401 Wheatland Way
- 7224 Mocha Dr
- 1501 Wheatland Way Unit n/a
- 1501 Wheatland Way
- 7221 Bronze Cir
- 7220 Mocha Dr
- 1408 Wheatland Way
- 1404 Wheatland Way
- 1505 Wheatland Way
- 1400 Wheatland Way
- 7217 Bronze Cir
- 7216 Mocha Dr Unit n/a
- 7216 Mocha Dr
- 1416 Wheatland Way
- 1337 Wheatland Way