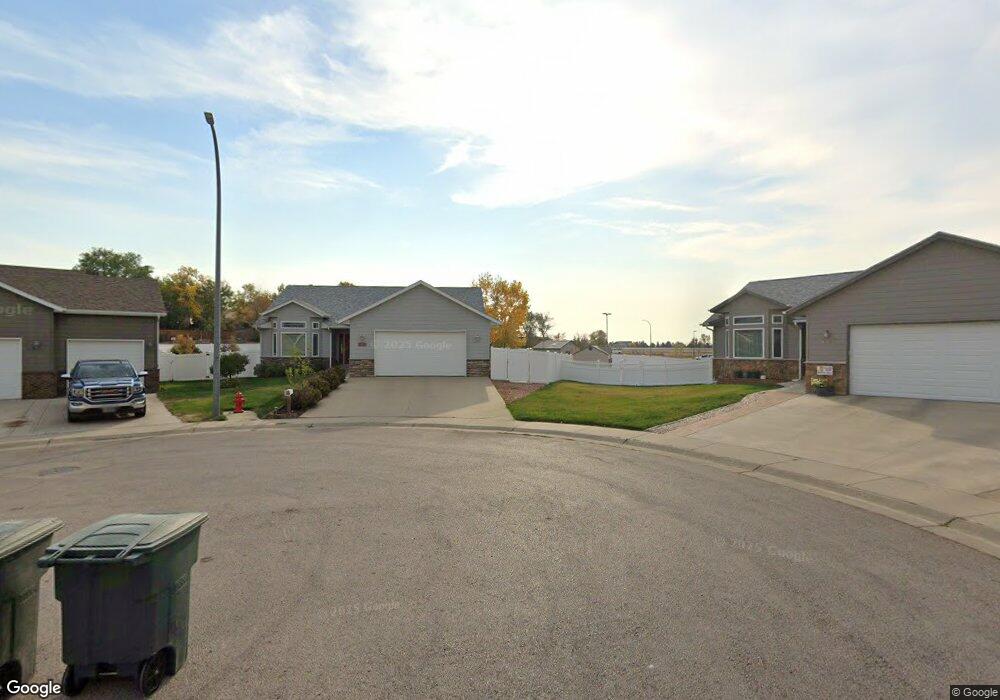
1409 Wisteria Ct Gillette, WY 82716
Estimated Value: $204,000 - $398,425
3
Beds
3
Baths
1,569
Sq Ft
$219/Sq Ft
Est. Value
About This Home
This home is located at 1409 Wisteria Ct, Gillette, WY 82716 and is currently estimated at $343,356, approximately $218 per square foot. 1409 Wisteria Ct is a home located in Campbell County with nearby schools including Westwood High School, Hillcrest Elementary School, and Twin Spruce Junior High School.
Ownership History
Date
Name
Owned For
Owner Type
Purchase Details
Closed on
May 19, 2014
Sold by
Burke Rodney and Burke Patricia J
Bought by
Metcalf Barbara A
Current Estimated Value
Purchase Details
Closed on
Jul 24, 2006
Sold by
Cloud Peak Management Group Llc
Bought by
Burke Rodney and Burke Patricia J
Home Financials for this Owner
Home Financials are based on the most recent Mortgage that was taken out on this home.
Original Mortgage
$206,400
Interest Rate
6.6%
Mortgage Type
New Conventional
Purchase Details
Closed on
May 26, 2006
Sold by
Schilling Trevor and Schilling Jodi
Bought by
Cloud Peak Management Group Llc
Home Financials for this Owner
Home Financials are based on the most recent Mortgage that was taken out on this home.
Original Mortgage
$206,400
Interest Rate
6.6%
Mortgage Type
New Conventional
Create a Home Valuation Report for This Property
The Home Valuation Report is an in-depth analysis detailing your home's value as well as a comparison with similar homes in the area
Home Values in the Area
Average Home Value in this Area
Purchase History
| Date | Buyer | Sale Price | Title Company |
|---|---|---|---|
| Metcalf Barbara A | -- | None Available | |
| Burke Rodney | -- | Stewart Title Company | |
| Cloud Peak Management Group Llc | -- | Stewart Title Company Of Gil |
Source: Public Records
Mortgage History
| Date | Status | Borrower | Loan Amount |
|---|---|---|---|
| Previous Owner | Burke Rodney | $206,400 | |
| Previous Owner | Cloud Peak Management Group Llc | $137,059 |
Source: Public Records
Tax History Compared to Growth
Tax History
| Year | Tax Paid | Tax Assessment Tax Assessment Total Assessment is a certain percentage of the fair market value that is determined by local assessors to be the total taxable value of land and additions on the property. | Land | Improvement |
|---|---|---|---|---|
| 2025 | $2,545 | $28,104 | $4,147 | $23,957 |
| 2024 | $2,545 | $36,198 | $5,317 | $30,881 |
| 2023 | $2,595 | $36,886 | $6,248 | $30,638 |
| 2022 | $2,210 | $31,330 | $5,773 | $25,557 |
| 2021 | $1,938 | $28,628 | $4,823 | $23,805 |
| 2020 | $1,938 | $28,473 | $4,823 | $23,650 |
| 2019 | $1,760 | $25,910 | $4,823 | $21,087 |
| 2018 | $1,700 | $25,146 | $4,823 | $20,323 |
| 2017 | $1,727 | $25,594 | $4,750 | $20,844 |
| 2016 | $1,804 | $26,711 | $4,038 | $22,673 |
| 2015 | -- | $26,113 | $4,038 | $22,075 |
| 2014 | -- | $23,377 | $4,038 | $19,339 |
Source: Public Records
Map
Nearby Homes
- 210 Overland Trail
- 1603 Monte Vista Ln
- 1706 Monte Vista Ln
- 1137 Boxelder Rd
- 913 A&B E 12th St
- 102 Overland Trail
- 4155 Butler-Spaeth Rd
- 1122 Boxelder Rd
- 1041 Teton Cir
- 1033 Santee Dr
- 1028 E 9th St
- 1116 Boxelder Rd
- 905 S Gurley Ave
- 1285 Country Club Rd
- 821 Madison St
- 9 Highland Ct
- 0 Boxelder Rd Unit 16-116
- 814 E 3rd St
- 700 S Brooks Ave
- 480 Boxelder Rd
- 1408 Wisteria Ct
- 1405 Wisteria Ct
- 1401 Wisteria Ct
- 1404 Wisteria Ct
- 1400 Wisteria Ct
- 1331 Wisteria Ct
- 1409 Carmel Ct
- 1405 Carmel Ct
- 1405 Carmel Ct Unit Wisteria Ct
- 1330 Wisteria Ct
- 1413 Carmel Ct
- 1400 Oshannon Dr
- 1402 Oshannon Dr
- 1401 Carmel Ct
- 1308 Oshannon Dr
- 1404 Oshannon Dr
- 1306 Oshannon Dr
- 1329 Carmel Ct
- 1405 Apple Blossom Way
- 1409 Apple Blossom Way