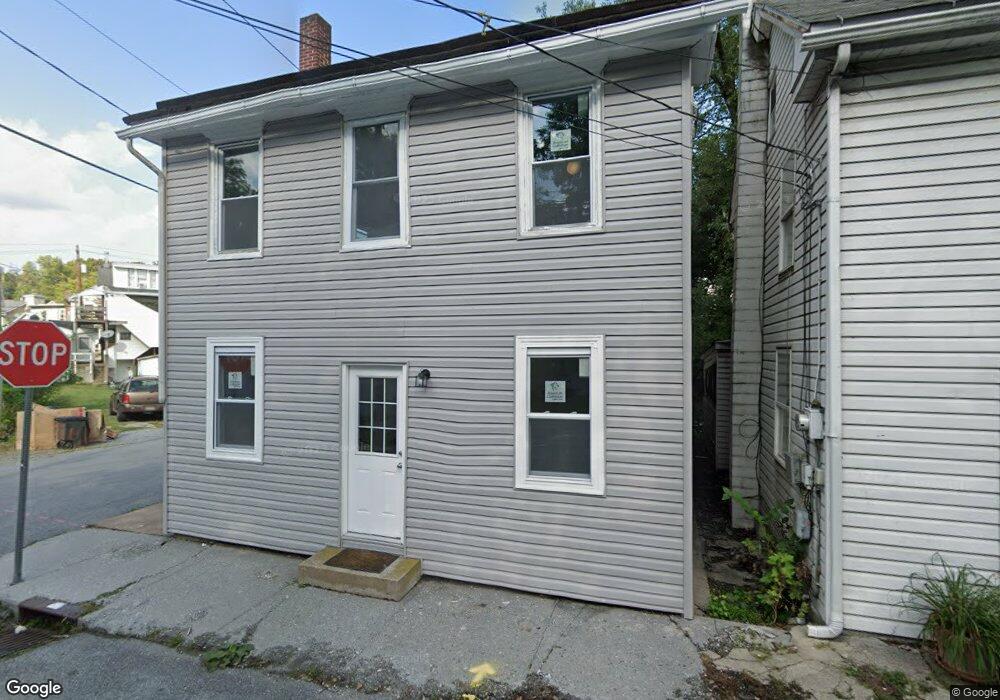
141 3rd St Enola, PA 17025
East Pennsboro NeighborhoodEstimated Value: $144,000 - $233,524
4
Beds
2
Baths
1,828
Sq Ft
$111/Sq Ft
Est. Value
About This Home
This home is located at 141 3rd St, Enola, PA 17025 and is currently estimated at $203,381, approximately $111 per square foot. 141 3rd St is a home located in Cumberland County with nearby schools including East Pennsboro Area Middle School, East Pennsboro Area Senior High School, and Harrisburg Academy.
Ownership History
Date
Name
Owned For
Owner Type
Purchase Details
Closed on
Feb 16, 2024
Sold by
Penn Properties Associates Llc
Bought by
Garcia Miguel Joseph
Current Estimated Value
Home Financials for this Owner
Home Financials are based on the most recent Mortgage that was taken out on this home.
Original Mortgage
$211,105
Outstanding Balance
$207,409
Interest Rate
6.66%
Mortgage Type
FHA
Estimated Equity
-$4,028
Purchase Details
Closed on
Jun 14, 2023
Sold by
Gable Properties Llc
Bought by
Penn Properties Associates Llc
Purchase Details
Closed on
Aug 28, 2018
Sold by
Orris Ii Donald T
Bought by
Gable Properties Llc
Home Financials for this Owner
Home Financials are based on the most recent Mortgage that was taken out on this home.
Original Mortgage
$40,000
Interest Rate
4.5%
Mortgage Type
Unknown
Create a Home Valuation Report for This Property
The Home Valuation Report is an in-depth analysis detailing your home's value as well as a comparison with similar homes in the area
Home Values in the Area
Average Home Value in this Area
Purchase History
| Date | Buyer | Sale Price | Title Company |
|---|---|---|---|
| Garcia Miguel Joseph | $215,000 | None Listed On Document | |
| Penn Properties Associates Llc | $80,000 | None Listed On Document | |
| Gable Properties Llc | $45,000 | None Available |
Source: Public Records
Mortgage History
| Date | Status | Borrower | Loan Amount |
|---|---|---|---|
| Open | Garcia Miguel Joseph | $211,105 | |
| Previous Owner | Gable Properties Llc | $40,000 |
Source: Public Records
Tax History
| Year | Tax Paid | Tax Assessment Tax Assessment Total Assessment is a certain percentage of the fair market value that is determined by local assessors to be the total taxable value of land and additions on the property. | Land | Improvement |
|---|---|---|---|---|
| 2025 | $2,178 | $105,500 | $16,700 | $88,800 |
| 2024 | $2,054 | $105,500 | $16,700 | $88,800 |
| 2023 | $1,938 | $105,500 | $16,700 | $88,800 |
| 2022 | $1,822 | $105,500 | $16,700 | $88,800 |
| 2021 | $1,791 | $105,500 | $16,700 | $88,800 |
| 2020 | $13,503 | $105,500 | $16,700 | $88,800 |
| 2019 | $1,728 | $105,500 | $16,700 | $88,800 |
| 2018 | $1,709 | $105,500 | $16,700 | $88,800 |
| 2017 | -- | $105,500 | $16,700 | $88,800 |
| 2016 | -- | $105,500 | $16,700 | $88,800 |
| 2015 | -- | $105,500 | $16,700 | $88,800 |
| 2014 | -- | $105,500 | $16,700 | $88,800 |
Source: Public Records
Map
Nearby Homes
Your Personal Tour Guide
Ask me questions while you tour the home.