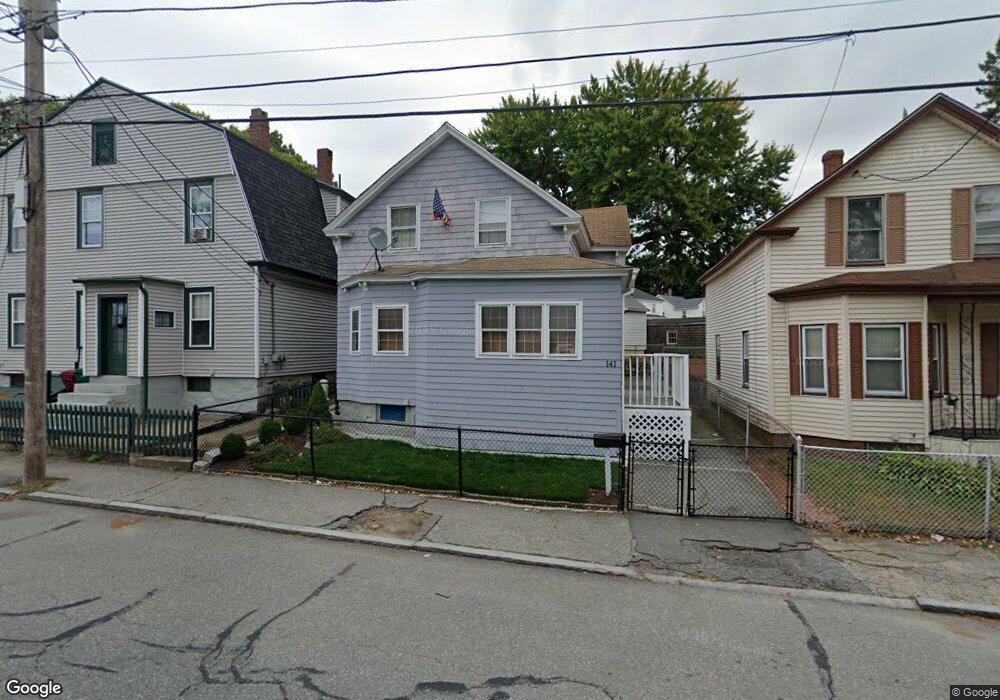
141 Aiken Ave Lowell, MA 01850
Centralville NeighborhoodEstimated Value: $388,945 - $410,000
3
Beds
1
Bath
1,235
Sq Ft
$320/Sq Ft
Est. Value
About This Home
This home is located at 141 Aiken Ave, Lowell, MA 01850 and is currently estimated at $394,736, approximately $319 per square foot. 141 Aiken Ave is a home located in Middlesex County with nearby schools including Greenhalge Elementary School, S. Christa McAuliffe Elementary School, and Moody Elementary School.
Ownership History
Date
Name
Owned For
Owner Type
Purchase Details
Closed on
Jun 6, 2025
Sold by
Gauthier Eugene L
Bought by
Gauthier Ft and Gauthier
Current Estimated Value
Purchase Details
Closed on
Dec 27, 2001
Sold by
Hebert Albert
Bought by
Gauthier Eugene L
Home Financials for this Owner
Home Financials are based on the most recent Mortgage that was taken out on this home.
Original Mortgage
$134,995
Interest Rate
6.61%
Mortgage Type
Purchase Money Mortgage
Purchase Details
Closed on
Nov 1, 1995
Sold by
Chen Pi Tung and Min Lee
Bought by
Hebert Albert
Purchase Details
Closed on
Aug 2, 1991
Sold by
Lawrence Sb
Bought by
Chen Pi-Tung
Purchase Details
Closed on
Apr 25, 1991
Sold by
Maclauchlan Thomas
Bought by
Lawrence Sb
Create a Home Valuation Report for This Property
The Home Valuation Report is an in-depth analysis detailing your home's value as well as a comparison with similar homes in the area
Home Values in the Area
Average Home Value in this Area
Purchase History
| Date | Buyer | Sale Price | Title Company |
|---|---|---|---|
| Gauthier Ft | -- | None Available | |
| Gauthier Ft | -- | None Available | |
| Gauthier Eugene L | $140,000 | -- | |
| Gauthier Eugene L | $140,000 | -- | |
| Hebert Albert | $69,000 | -- | |
| Hebert Albert | $69,000 | -- | |
| Chen Pi-Tung | $59,000 | -- | |
| Chen Pi-Tung | $59,000 | -- | |
| Lawrence Sb | $52,500 | -- | |
| Lawrence Sb | $52,500 | -- |
Source: Public Records
Mortgage History
| Date | Status | Borrower | Loan Amount |
|---|---|---|---|
| Previous Owner | Lawrence Sb | $126,875 | |
| Previous Owner | Lawrence Sb | $134,995 |
Source: Public Records
Tax History
| Year | Tax Paid | Tax Assessment Tax Assessment Total Assessment is a certain percentage of the fair market value that is determined by local assessors to be the total taxable value of land and additions on the property. | Land | Improvement |
|---|---|---|---|---|
| 2025 | $3,693 | $321,700 | $103,700 | $218,000 |
| 2024 | $3,550 | $298,100 | $92,600 | $205,500 |
| 2023 | $3,278 | $263,900 | $74,900 | $189,000 |
| 2022 | $2,931 | $231,000 | $64,700 | $166,300 |
| 2021 | $2,735 | $203,200 | $56,300 | $146,900 |
| 2020 | $2,744 | $205,400 | $65,900 | $139,500 |
| 2019 | $2,412 | $171,800 | $54,800 | $117,000 |
| 2018 | $2,359 | $163,900 | $52,200 | $111,700 |
| 2017 | $2,232 | $149,600 | $43,300 | $106,300 |
| 2016 | $2,081 | $137,300 | $40,100 | $97,200 |
| 2015 | $2,014 | $130,100 | $40,100 | $90,000 |
| 2013 | $1,906 | $127,000 | $46,300 | $80,700 |
Source: Public Records
Map
Nearby Homes
- 15 Dana St
- 26 Farmland Rd Unit C
- 345 Hildreth St Unit 14
- 367 Hildreth St Unit 14
- 417 Hildreth St Unit 30
- 27 Bunker Hill Ave
- 23 18th St
- 35 Whitney Ave Unit 33
- 99 W 6th St
- 16 Peabody Ave
- 18 May St
- 52 Lawrence Dr Unit 206
- 75 Sladen St
- 106 Methuen St Unit B
- 174 River Rd
- 551 Hildreth St Unit 10
- 45 W 4th St
- 49 Sparks St
- 175 Willard St Unit 9
- 27-29 Fifth St
- 139 Aiken Ave
- 48 Dana St
- 46 Dana St
- 137 Aiken Ave
- 135 Aiken Ave
- 146 Aiken Ave
- 150 Aiken Ave
- 225 Cumberland Rd
- 213 Cumberland Rd
- 233 Cumberland Rd
- 30 Dana St
- 169 Aiken Ave Unit 1
- 169 Aiken Ave Unit 16
- 169 Aiken Ave Unit 5
- 169 Aiken Ave
- 35 Dana St
- 207 Cumberland Rd Unit 2
- 207 Cumberland Rd
- 207 Cumberland Rd Unit 1
- 31 Dana St
Your Personal Tour Guide
Ask me questions while you tour the home.