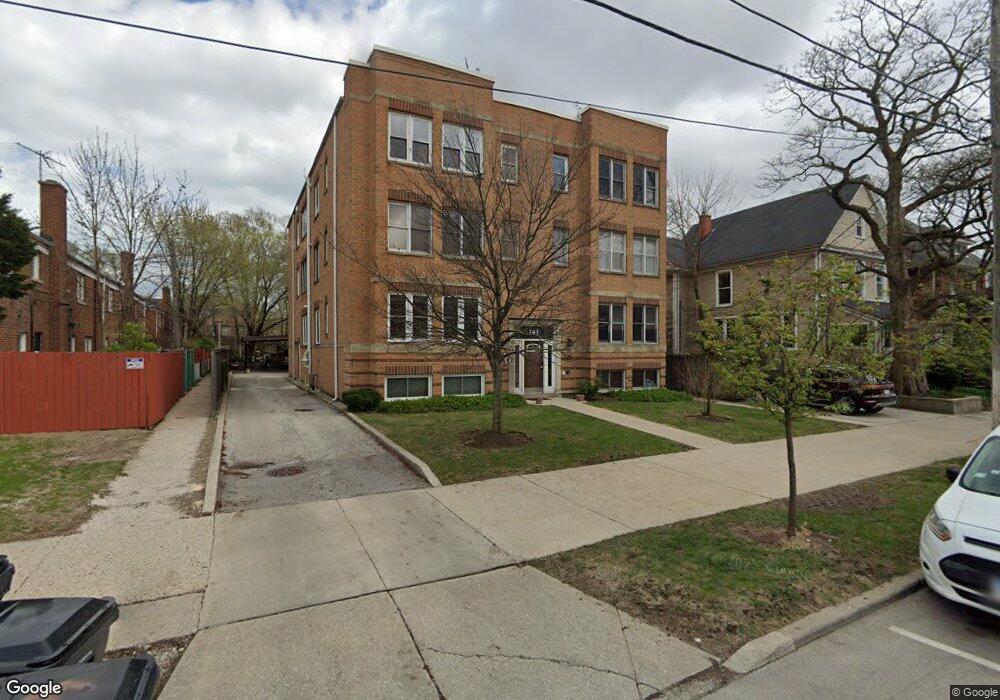
141 Asbury Ave Unit 3E Evanston, IL 60202
Howard Street NeighborhoodEstimated Value: $171,000 - $274,168
2
Beds
2
Baths
1,100
Sq Ft
$208/Sq Ft
Est. Value
About This Home
This home is located at 141 Asbury Ave Unit 3E, Evanston, IL 60202 and is currently estimated at $228,542, approximately $207 per square foot. 141 Asbury Ave Unit 3E is a home located in Cook County with nearby schools including Oakton Elementary School, Chute Middle School, and Evanston Township High School.
Ownership History
Date
Name
Owned For
Owner Type
Purchase Details
Closed on
Sep 16, 2025
Sold by
Li Guang Long and Wang Baoying
Bought by
Estrada Froylan and Vazquez Esther
Current Estimated Value
Purchase Details
Closed on
Feb 27, 2014
Sold by
Moulder John P
Bought by
Li Guang Long and Wang Baoying
Purchase Details
Closed on
Apr 30, 2004
Sold by
Rowe Rosfelt A and Rowe Kristi M
Bought by
Moulder John P
Home Financials for this Owner
Home Financials are based on the most recent Mortgage that was taken out on this home.
Original Mortgage
$155,000
Interest Rate
6.1%
Mortgage Type
Unknown
Purchase Details
Closed on
May 9, 2000
Sold by
Nelson Kirk E and Nelson Nicole M
Bought by
Rowe Rosfelt A and Rowe Kristen
Home Financials for this Owner
Home Financials are based on the most recent Mortgage that was taken out on this home.
Original Mortgage
$128,000
Interest Rate
8.26%
Create a Home Valuation Report for This Property
The Home Valuation Report is an in-depth analysis detailing your home's value as well as a comparison with similar homes in the area
Home Values in the Area
Average Home Value in this Area
Purchase History
| Date | Buyer | Sale Price | Title Company |
|---|---|---|---|
| Estrada Froylan | $162,000 | None Listed On Document | |
| Li Guang Long | $100,000 | Ct | |
| Moulder John P | $194,000 | Multiple | |
| Rowe Rosfelt A | $160,000 | Centennial Title Incorporate |
Source: Public Records
Mortgage History
| Date | Status | Borrower | Loan Amount |
|---|---|---|---|
| Previous Owner | Moulder John P | $155,000 | |
| Previous Owner | Rowe Rosfelt A | $128,000 | |
| Closed | Moulder John P | $29,100 |
Source: Public Records
Tax History Compared to Growth
Tax History
| Year | Tax Paid | Tax Assessment Tax Assessment Total Assessment is a certain percentage of the fair market value that is determined by local assessors to be the total taxable value of land and additions on the property. | Land | Improvement |
|---|---|---|---|---|
| 2024 | $4,846 | $19,758 | $2,274 | $17,484 |
| 2023 | $4,649 | $19,758 | $2,274 | $17,484 |
| 2022 | $4,649 | $19,758 | $2,274 | $17,484 |
| 2021 | $2,773 | $10,309 | $1,208 | $9,101 |
| 2020 | $2,735 | $10,309 | $1,208 | $9,101 |
| 2019 | $2,730 | $11,503 | $1,208 | $10,295 |
| 2018 | $2,907 | $10,473 | $994 | $9,479 |
| 2017 | $2,831 | $10,473 | $994 | $9,479 |
| 2016 | $2,685 | $10,473 | $994 | $9,479 |
| 2015 | $3,224 | $11,855 | $1,492 | $10,363 |
| 2014 | $3,510 | $15,599 | $1,492 | $14,107 |
| 2013 | $3,413 | $15,599 | $1,492 | $14,107 |
Source: Public Records
Map
Nearby Homes
- 1200 Dobson St
- 1317 Brummel St
- 1406 Brummel St
- 7546 N Oakley Ave
- 7519 N Claremont Ave Unit 2S
- 1214 Hull Terrace
- 200 Ridge Ave Unit 2C
- 1217 Hull Terrace Unit 3A
- 250 Ridge Ave Unit 4L
- 209 Ridge Ave
- 7540 N Ridge Blvd Unit 5C
- 819 Brummel St Unit 3S
- 408 Asbury Ave
- 400 Ridge Ave Unit 16-2
- 803 Brummel St
- 419 Florence Ave
- 2522 W Jarvis Ave
- 1726 Dobson St
- 309 Darrow Ave
- 401 Dewey Ave
- 141 Asbury Ave Unit 3S
- 141 Asbury Ave Unit 2S
- 141 Asbury Ave Unit 2E
- 141 Asbury Ave Unit P4
- 141 Asbury Ave Unit P2
- 141 Asbury Ave Unit 1G
- 141 Asbury Ave Unit 2N
- 141 Asbury Ave Unit G2
- 141 Asbury Ave Unit 1N
- 141 Asbury Ave Unit P1
- 141 Asbury Ave Unit P3
- 141 Asbury Ave Unit 3G
- 141 Asbury Ave Unit 3N
- 141 Asbury Ave Unit 1S
- 141 Asbury Ave Unit P5
- 137 Asbury Ave
- 151 Asbury Ave
- 153 Asbury Ave
- 149 Asbury Ave
- 155 Asbury Ave