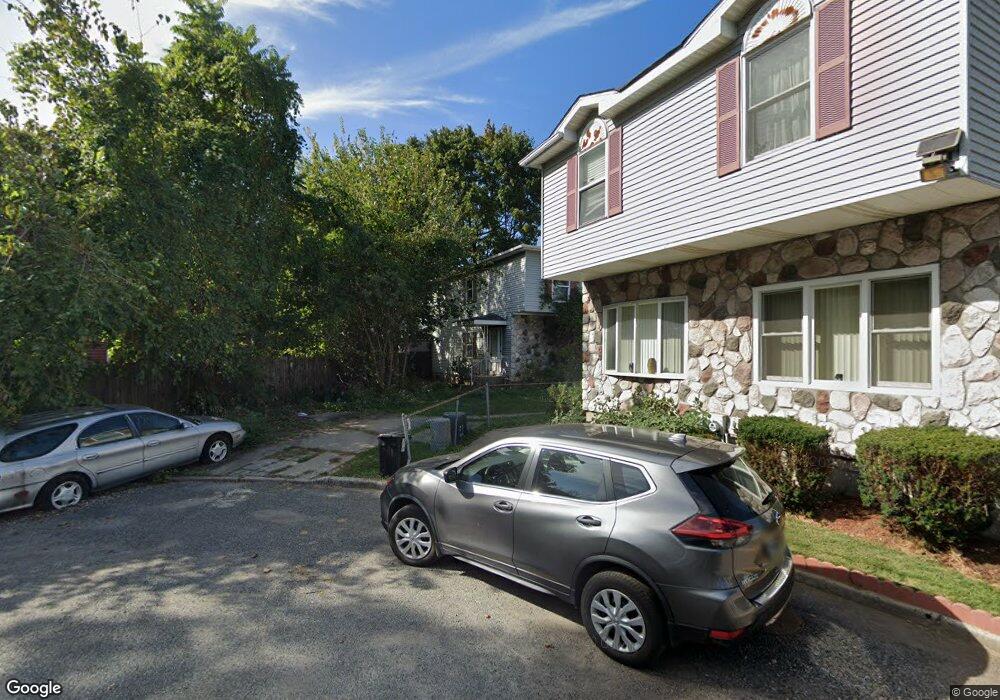
141 Bement Ct Staten Island, NY 10310
West Brighton NeighborhoodEstimated Value: $481,000 - $532,000
--
Bed
4
Baths
888
Sq Ft
$563/Sq Ft
Est. Value
About This Home
This home is located at 141 Bement Ct, Staten Island, NY 10310 and is currently estimated at $500,314, approximately $563 per square foot. 141 Bement Ct is a home located in Richmond County with nearby schools including P.S. 18 John G. Whittier, Intermediate School 27, and Curtis High School.
Ownership History
Date
Name
Owned For
Owner Type
Purchase Details
Closed on
Nov 24, 2021
Sold by
Carlson Arthur
Bought by
Diaz Armando Ramos and Jimenez Arriaga Angelica
Current Estimated Value
Home Financials for this Owner
Home Financials are based on the most recent Mortgage that was taken out on this home.
Original Mortgage
$379,990
Outstanding Balance
$349,397
Interest Rate
3.09%
Mortgage Type
FHA
Estimated Equity
$150,917
Purchase Details
Closed on
Apr 29, 2021
Sold by
Gray Anna S
Bought by
Carlson Arthur
Home Financials for this Owner
Home Financials are based on the most recent Mortgage that was taken out on this home.
Original Mortgage
$105,000
Interest Rate
3%
Mortgage Type
Seller Take Back
Create a Home Valuation Report for This Property
The Home Valuation Report is an in-depth analysis detailing your home's value as well as a comparison with similar homes in the area
Home Values in the Area
Average Home Value in this Area
Purchase History
| Date | Buyer | Sale Price | Title Company |
|---|---|---|---|
| Diaz Armando Ramos | $387,000 | Forest Abstract Llc | |
| Carlson Arthur | $130,000 | Princeton Abstract Inc |
Source: Public Records
Mortgage History
| Date | Status | Borrower | Loan Amount |
|---|---|---|---|
| Open | Diaz Armando Ramos | $379,990 | |
| Previous Owner | Carlson Arthur | $105,000 |
Source: Public Records
Tax History Compared to Growth
Tax History
| Year | Tax Paid | Tax Assessment Tax Assessment Total Assessment is a certain percentage of the fair market value that is determined by local assessors to be the total taxable value of land and additions on the property. | Land | Improvement |
|---|---|---|---|---|
| 2025 | $4,139 | $30,600 | $3,598 | $27,002 |
| 2024 | $4,139 | $27,540 | $3,771 | $23,769 |
| 2023 | $3,948 | $19,440 | $3,299 | $16,141 |
| 2022 | $3,864 | $28,140 | $5,040 | $23,100 |
| 2021 | $3,909 | $29,640 | $5,040 | $24,600 |
| 2020 | $7,488 | $26,520 | $5,040 | $21,480 |
| 2019 | $3,592 | $23,040 | $5,040 | $18,000 |
| 2018 | $3,302 | $16,200 | $4,111 | $12,089 |
| 2017 | $3,288 | $16,128 | $3,574 | $12,554 |
| 2016 | $3,095 | $15,480 | $4,249 | $11,231 |
| 2015 | $2,746 | $15,168 | $3,636 | $11,532 |
| 2014 | $2,746 | $14,310 | $4,122 | $10,188 |
Source: Public Records
Map
Nearby Homes
- 154 Pelton Ave
- 16 Howard Ct
- 163 Bement Ave
- 84 Elm St
- 70 Elm St
- 188 Davis Ave
- 21 Elizabeth Ave
- 154 Bard Ave Unit 14A
- 160 Bard Ave Unit 6A
- 144 Bard Ave Unit 25b
- 11 Curtis Ct
- 699 Henderson Ave
- 698 Henderson Ave
- 718 Henderson Ave
- 207 N Burgher Ave
- 943 Castleton Ave
- 110 Kissel Ave
- 46 Winegar Ln
- 1001 Castleton Ave
- 331 Oakland Ave
- 139 Bement Ct
- 135 Bement Ct
- 111 Bement Ave
- 133 Bement Ct
- 129 Bement Ct
- 109 Bement Ave
- 172 Harrison Place
- 176 Harrison Place
- 168 Harrison Place
- 181 Bement Ct
- 127 Bement Ct
- 183 Bement Ct
- 180 Harrison Place
- 115 Bement Ave
- 179 Bement Ct
- 145 Bement Ct
- 117 Bement Ave
- 175 Bement Ct
- 164 Harrison Place
- 187 Bement Ct