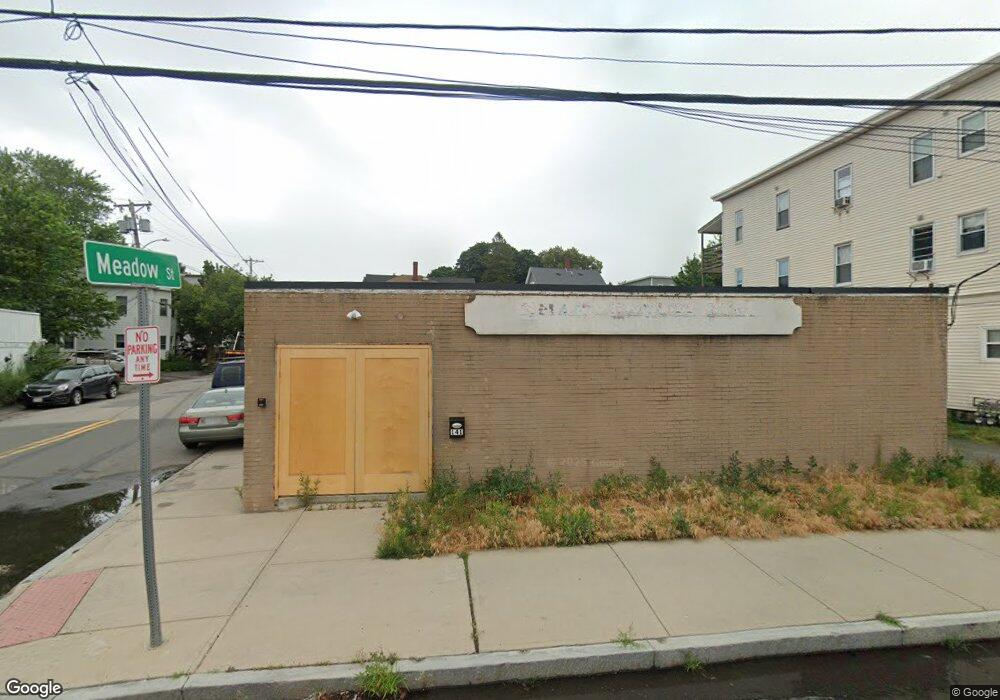
141 Canal St Salem, MA 01970
South Salem NeighborhoodEstimated Value: $325,795
3
Beds
2
Baths
1,000
Sq Ft
$326/Sq Ft
Est. Value
About This Home
AVAILABLE OCTOBER 1 - Stunning newly renovated 3 bedroom, 1 bathroom apartment near Downtown Salem. Gorgeous kitchen that has Granite Counter Tops, Shaker Cabinets & Stainless-Steel Appliances. Standup shower with tiles throughout. Good bedroom size with Vinyl Floors Throughout. This location is in the South Salem neighborhood in Salem. Nearby parks include Castle Hill Park, Bertram Field and Conservation Land. Laundry In Building & Street Permit Parking Available. This will go fast!
Ownership History
Date
Name
Owned For
Owner Type
Purchase Details
Closed on
May 25, 1999
Sold by
Robinson Rt and Robinson
Bought by
Morneau Paul H
Current Estimated Value
Create a Home Valuation Report for This Property
The Home Valuation Report is an in-depth analysis detailing your home's value as well as a comparison with similar homes in the area
Home Values in the Area
Average Home Value in this Area
Purchase History
| Date | Buyer | Sale Price | Title Company |
|---|---|---|---|
| Morneau Paul H | $80,000 | -- |
Source: Public Records
Property History
| Date | Event | Price | List to Sale | Price per Sq Ft |
|---|---|---|---|---|
| 10/08/2024 10/08/24 | Off Market | $2,800 | -- | -- |
| 10/01/2024 10/01/24 | For Rent | $2,800 | -- | -- |
Tax History
| Year | Tax Paid | Tax Assessment Tax Assessment Total Assessment is a certain percentage of the fair market value that is determined by local assessors to be the total taxable value of land and additions on the property. | Land | Improvement |
|---|---|---|---|---|
| 2025 | $5,463 | $241,500 | $129,500 | $112,000 |
| 2024 | $4,932 | $208,200 | $117,300 | $90,900 |
| 2023 | $4,934 | $195,400 | $111,800 | $83,600 |
| 2022 | $4,781 | $181,700 | $98,100 | $83,600 |
| 2021 | $4,802 | $174,000 | $91,800 | $82,200 |
| 2020 | $4,618 | $162,500 | $88,000 | $74,500 |
| 2019 | $4,506 | $152,500 | $78,000 | $74,500 |
| 2018 | $3,740 | $124,800 | $50,300 | $74,500 |
| 2017 | $3,743 | $124,800 | $50,300 | $74,500 |
| 2016 | $3,688 | $124,800 | $50,300 | $74,500 |
| 2015 | $3,700 | $119,400 | $44,900 | $74,500 |
Source: Public Records
Map
Nearby Homes
- 101 Ocean Ave
- 3 Wisteria St Unit 2
- 10 Hazel St Unit 2
- 6R Hazel Terrace Unit 1
- 16.5 Holly St Unit 2L
- 263 Jefferson Ave
- 79 Lawrence St
- 106 Broadway Unit 3
- 29 Ocean Ave Unit 4
- 6 Arthur St Unit 3
- 233 Lafayette St
- 29 Willson St
- 5 Gardner St Unit 3
- 25 Eden St Unit 2
- 1 Shore Ave
- 7 Fairfield St
- 2 Naples Rd Unit 1
- 4 Fairview Rd
- 9 Glover St Unit 1
- 81 Loring Ave
- 141 Canal St Unit 2
- 143 Canal St
- 143 Canal St Unit 6
- 143 Canal St Unit 8
- 15 Meadow St
- 94 Ocean Ave
- 14 1/2 Meadow St
- 13 Meadow St
- 13 1/2 Meadow St
- 13 1/2 Meadow St Unit 13
- 13.5 Meadow St Unit 13.5
- 13.5 Meadow St
- 13 Meadow St Unit 1
- 13 Meadow St Unit 2
- 13.5 Meadow St Unit 13H
- 135 Canal St
- 12 Meadow St
- 12 Meadow St Unit 2
- 12 Meadow St Unit 1
- 144 Canal St
Your Personal Tour Guide
Ask me questions while you tour the home.