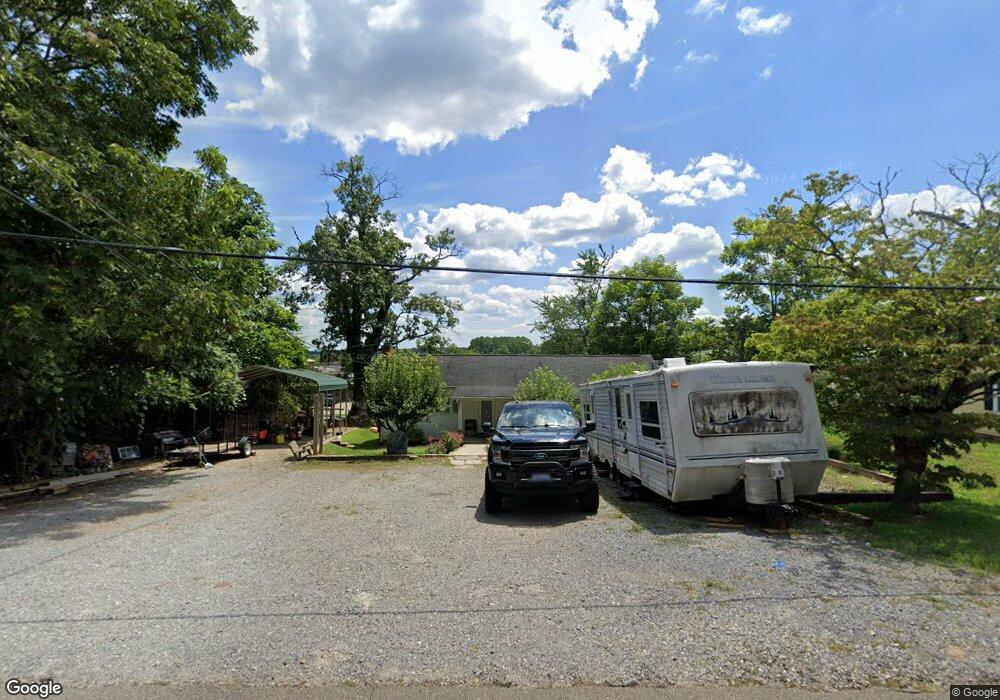
141 Chambers St Jasper, GA 30143
Estimated Value: $158,564 - $235,000
--
Bed
1
Bath
1,225
Sq Ft
$166/Sq Ft
Est. Value
About This Home
This home is located at 141 Chambers St, Jasper, GA 30143 and is currently estimated at $202,891, approximately $165 per square foot. 141 Chambers St is a home located in Pickens County with nearby schools including Tate Elementary School, Pickens County Middle School, and Pickens County High School.
Ownership History
Date
Name
Owned For
Owner Type
Purchase Details
Closed on
Sep 8, 2017
Sold by
Clark
Bought by
Andrade Maria Nora Delia Contr
Current Estimated Value
Home Financials for this Owner
Home Financials are based on the most recent Mortgage that was taken out on this home.
Original Mortgage
$88,622
Outstanding Balance
$73,946
Interest Rate
3.87%
Mortgage Type
FHA
Estimated Equity
$128,945
Purchase Details
Closed on
Oct 6, 2000
Sold by
Barrett Marian F
Bought by
Clark John W
Purchase Details
Closed on
Oct 20, 1999
Sold by
Bank Of North Georgi
Bought by
Barrett Marian F
Purchase Details
Closed on
Aug 23, 1995
Bought by
Colley Mark and Colley Beth
Purchase Details
Closed on
Jan 1, 1981
Bought by
Moore Maxine W and Westbrook Don
Create a Home Valuation Report for This Property
The Home Valuation Report is an in-depth analysis detailing your home's value as well as a comparison with similar homes in the area
Home Values in the Area
Average Home Value in this Area
Purchase History
| Date | Buyer | Sale Price | Title Company |
|---|---|---|---|
| Andrade Maria Nora Delia Contr | $94,000 | -- | |
| Clark John W | $77,500 | -- | |
| Barrett Marian F | $49,000 | -- | |
| Colley Mark | $47,500 | -- | |
| Moore Maxine W | -- | -- |
Source: Public Records
Mortgage History
| Date | Status | Borrower | Loan Amount |
|---|---|---|---|
| Open | Andrade Maria Nora Delia Contr | $88,622 |
Source: Public Records
Tax History Compared to Growth
Tax History
| Year | Tax Paid | Tax Assessment Tax Assessment Total Assessment is a certain percentage of the fair market value that is determined by local assessors to be the total taxable value of land and additions on the property. | Land | Improvement |
|---|---|---|---|---|
| 2024 | $1,143 | $44,914 | $14,000 | $30,914 |
| 2023 | $1,167 | $44,914 | $14,000 | $30,914 |
| 2022 | $913 | $44,914 | $14,000 | $30,914 |
| 2021 | $824 | $37,824 | $14,000 | $23,824 |
| 2020 | $849 | $37,824 | $14,000 | $23,824 |
| 2019 | $868 | $37,824 | $14,000 | $23,824 |
| 2018 | $871 | $37,824 | $14,000 | $23,824 |
| 2017 | $632 | $26,838 | $14,000 | $12,838 |
| 2016 | $638 | $26,650 | $14,000 | $12,650 |
| 2015 | $623 | $26,650 | $14,000 | $12,650 |
| 2014 | $624 | $26,650 | $14,000 | $12,650 |
| 2013 | -- | $26,650 | $14,000 | $12,650 |
Source: Public Records
Map
Nearby Homes
- 240 Jacobs Way Unit F
- 68 W Church St
- 653 Pioneer Rd
- 288 Blazingstar Trail
- 261 Deerberry Dr
- 007 Dottie Ln
- 006 Dottie Ln
- 005 Dottie Ln
- 004 Dottie Ln
- 003 Dottie Ln
- 002 Dottie Ln
- 001 Dottie Ln
- 287 Lookout Valley Trail
- 72 W Sellers St
- 9 Summit St Unit 9
- 5566 Red Fox Ln
- 280 Vistaview Pkwy
- 0 Lower Sassafras Pkwy Unit 24570415
- 321 Owls Brow
- 638 Wake Robin Dr
- 157 Chambers St
- 123 Chambers St
- 158 Chambers St
- 130 Chambers St
- 179 Chambers St
- 101 Chambers St
- 180 Chambers St
- 100 Chambers St
- 0 Chambers St Unit 7535292
- 0 Chambers St Unit 8758728
- 0 Chambers St Unit 8240651
- 197 Chambers St
- 21 Sanderlin
- 40 Sanderlin
- 44 Chambers St
- 196 Chambers St
- 371 N Main St
- 225 Chambers St
- 295 N Main St Unit K
- 295 N Main St Unit D