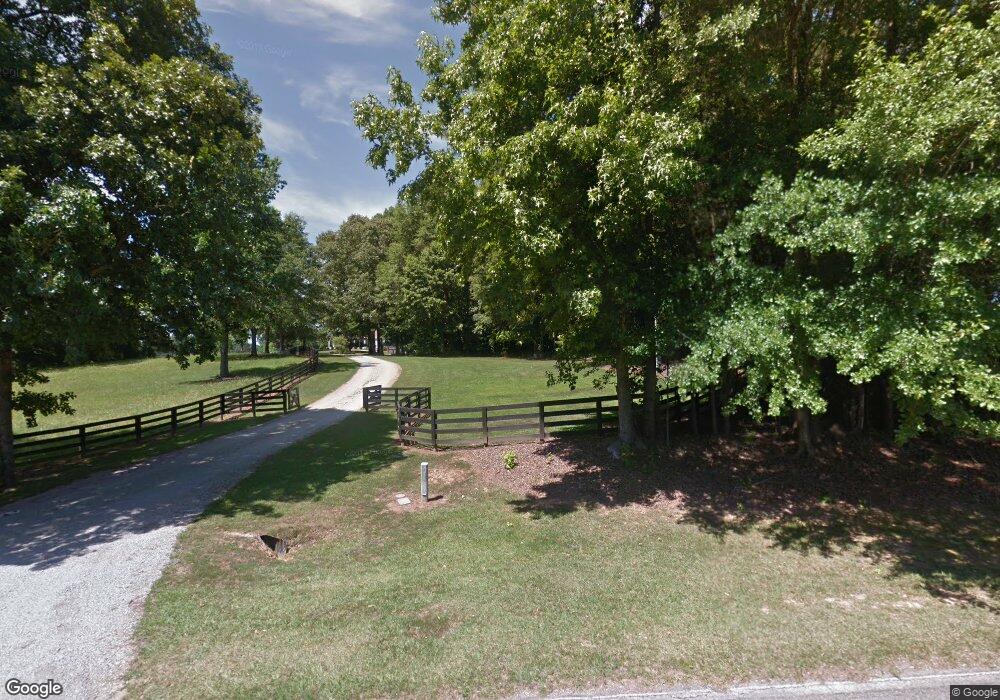
141 Chandler Rd Newnan, GA 30263
Estimated Value: $988,000 - $1,828,000
4
Beds
4
Baths
2,994
Sq Ft
$434/Sq Ft
Est. Value
About This Home
This home is located at 141 Chandler Rd, Newnan, GA 30263 and is currently estimated at $1,299,899, approximately $434 per square foot. 141 Chandler Rd is a home with nearby schools including Ruth Hill Elementary School, Smokey Road Middle School, and Newnan High School.
Ownership History
Date
Name
Owned For
Owner Type
Purchase Details
Closed on
Oct 18, 2002
Sold by
Lachey Michael J
Bought by
Lachey Michael J and Lachey Barbara J
Current Estimated Value
Home Financials for this Owner
Home Financials are based on the most recent Mortgage that was taken out on this home.
Original Mortgage
$257,000
Outstanding Balance
$108,139
Interest Rate
6.21%
Mortgage Type
New Conventional
Estimated Equity
$1,191,760
Purchase Details
Closed on
Oct 16, 2002
Sold by
Lachey Barbara L
Bought by
Lachey Michael J
Home Financials for this Owner
Home Financials are based on the most recent Mortgage that was taken out on this home.
Original Mortgage
$257,000
Outstanding Balance
$108,139
Interest Rate
6.21%
Mortgage Type
New Conventional
Estimated Equity
$1,191,760
Purchase Details
Closed on
Jan 9, 1998
Bought by
Lachey Michael J and Lachey B
Purchase Details
Closed on
Jun 7, 1997
Bought by
Lachey Michael J and Lachey B
Purchase Details
Closed on
Oct 29, 1969
Bought by
Ambrose Samuel S Dr
Create a Home Valuation Report for This Property
The Home Valuation Report is an in-depth analysis detailing your home's value as well as a comparison with similar homes in the area
Home Values in the Area
Average Home Value in this Area
Purchase History
| Date | Buyer | Sale Price | Title Company |
|---|---|---|---|
| Lachey Michael J | -- | -- | |
| Lachey Michael J | -- | -- | |
| Lachey Michael J | -- | -- | |
| Lachey Michael J | $176,000 | -- | |
| Ambrose Samuel S Dr | $101,000 | -- |
Source: Public Records
Mortgage History
| Date | Status | Borrower | Loan Amount |
|---|---|---|---|
| Open | Lachey Michael J | $257,000 |
Source: Public Records
Tax History Compared to Growth
Tax History
| Year | Tax Paid | Tax Assessment Tax Assessment Total Assessment is a certain percentage of the fair market value that is determined by local assessors to be the total taxable value of land and additions on the property. | Land | Improvement |
|---|---|---|---|---|
| 2024 | $4,433 | $344,646 | $115,283 | $229,363 |
| 2023 | $4,433 | $377,787 | $122,661 | $255,126 |
| 2022 | $4,944 | $292,003 | $106,517 | $185,486 |
| 2021 | $4,946 | $274,765 | $101,445 | $173,320 |
| 2020 | $4,968 | $274,765 | $101,445 | $173,320 |
| 2019 | $3,996 | $129,185 | $3,339 | $125,846 |
| 2018 | $3,994 | $129,185 | $3,339 | $125,846 |
| 2017 | $3,983 | $129,185 | $3,338 | $125,847 |
| 2016 | $3,928 | $129,185 | $3,339 | $125,846 |
| 2015 | $3,855 | $129,185 | $3,339 | $125,846 |
| 2014 | $3,809 | $129,185 | $3,339 | $125,846 |
Source: Public Records
Map
Nearby Homes
- 831 Holbrook Rd
- 975 Blalock Lakes Dr
- 150 Wild Boar Way
- 563 Blalock Lakes Dr
- 0 Mountain Creek Way Unit 10503086
- 780 Bruce Jackson Rd
- 0 George Arnold Rd Unit 7657652
- 0 George Arnold Rd Unit 10617612
- 320 Pleasant View Dr
- 729 Bruce Jackson Rd
- 164 I Walker Brooks Rd
- 1845 Smokey Rd
- 4059 Smokey Rd
- 15 Forest Place
- 19 Quimby Jackson Rd
- 2678 Highway 34 W
- 56 Fox Hollow Run
- 282 Sanders Davis Rd
- 57 Scout Way
- 4398 Georgia 34
- 115 Chandler Rd
- 91 Chandler Rd
- 0 Chandler Rd Unit 8626179
- 0 Chandler Rd Unit 8525050
- 0 Chandler Rd
- 71 Chandler Rd
- 285 Chandler Rd
- 255 Chandler Rd
- 68 Chandler Rd
- 3124 Smokey Rd
- 61 Chandler Rd
- 2910 Smokey Rd
- 2922 Smokey Rd
- 2930 Smokey Rd
- 2960 Smokey Rd
- 2886 Smokey Rd
- 3126 Smokey Rd
- Lot 2 Smokey Rd
- 268 Chandler Rd
- 3080 Smokey Rd