Estimated Value: $238,000 - $308,000
Studio
3
Baths
2,447
Sq Ft
$111/Sq Ft
Est. Value
About This Home
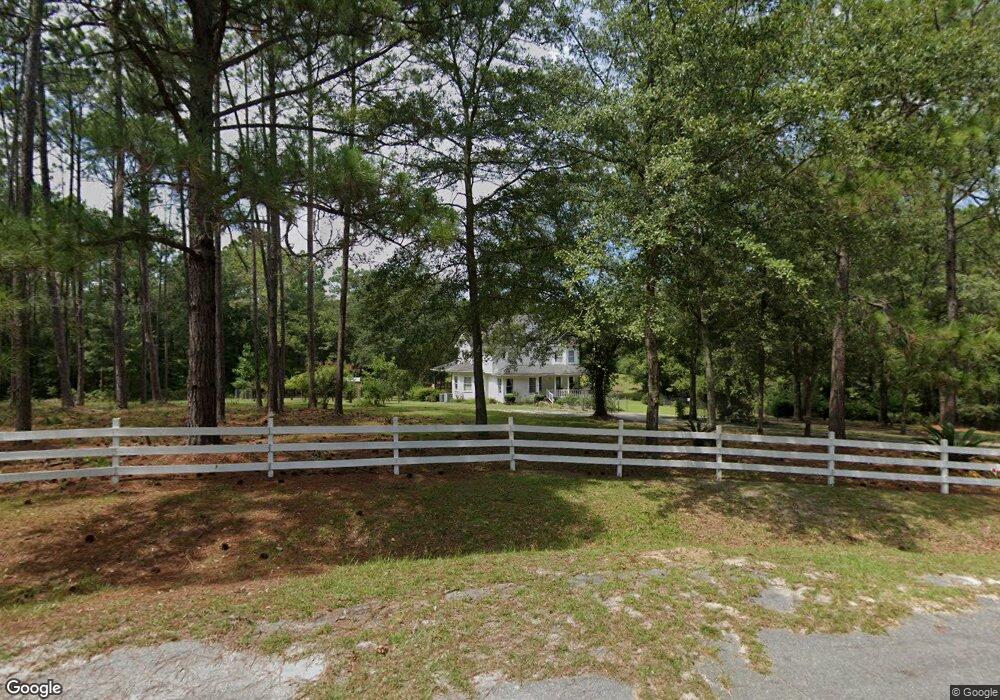
This home is located at 141 Crescent Ct, Lyons, GA 30436 and is currently estimated at $270,525, approximately $110 per square foot. 141 Crescent Ct is a home located in Toombs County with nearby schools including Toombs County High School and Robert Toombs Christian Academy.
Ownership History
Date
Name
Owned For
Owner Type
Purchase Details
Closed on
Dec 11, 1991
Bought by
Self Lee S
Current Estimated Value
Create a Home Valuation Report for This Property
The Home Valuation Report is an in-depth analysis detailing your home's value as well as a comparison with similar homes in the area
Home Values in the Area
Average Home Value in this Area
Purchase History
| Date | Buyer | Sale Price | Title Company |
|---|---|---|---|
| Self Lee S | $14,600 | -- |
Source: Public Records
Tax History
| Year | Tax Paid | Tax Assessment Tax Assessment Total Assessment is a certain percentage of the fair market value that is determined by local assessors to be the total taxable value of land and additions on the property. | Land | Improvement |
|---|---|---|---|---|
| 2025 | $1,467 | $94,724 | $11,340 | $83,384 |
| 2024 | $1,493 | $94,724 | $11,340 | $83,384 |
| 2023 | $1,535 | $96,707 | $11,340 | $85,367 |
| 2022 | $1,526 | $86,927 | $11,340 | $75,587 |
| 2021 | $1,556 | $80,834 | $11,340 | $69,494 |
| 2020 | $1,581 | $76,053 | $11,340 | $64,713 |
| 2019 | $1,526 | $76,053 | $11,340 | $64,713 |
| 2018 | $1,469 | $76,053 | $11,340 | $64,713 |
| 2017 | $1,470 | $71,769 | $11,340 | $60,429 |
| 2016 | $1,514 | $71,769 | $11,340 | $60,429 |
| 2015 | -- | $64,225 | $11,340 | $52,886 |
| 2014 | -- | $66,494 | $13,608 | $52,886 |
Source: Public Records
Map
Nearby Homes
- 253 McDilda Dr
- 107 Newton Dr
- 444 Aiken Cir
- 564 W Oglethorpe Ave
- 132 Ezra Taylor Rd
- 165 N Hamilton St
- 614 N Victory Dr
- 184 Belvue Ave
- 306 W Wesley Ave
- 172 W Leo Trapnell Ave
- 0 N Washington St
- 0 Mclemore St Unit 10678733
- 169 Ext N Jefferson St
- 177 Skyline Blvd
- 105 Skyline Blvd
- 130 S Washington St
- 0 N State St Unit 26009
- 221 Collins St
- 0 Victory Cir Unit 23870
- 0 Victory Cir Unit 10657838
Your Personal Tour Guide
Ask me questions while you tour the home.