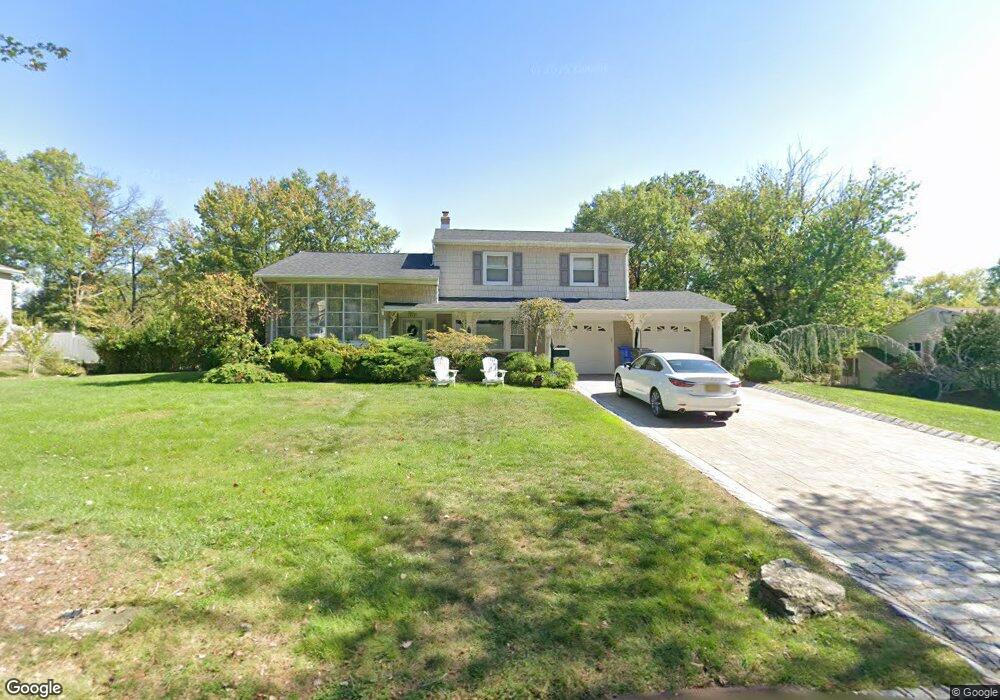
141 Devon Rd Colonia, NJ 07067
Estimated Value: $755,339 - $816,000
3
Beds
3
Baths
1,745
Sq Ft
$454/Sq Ft
Est. Value
About This Home
This home is located at 141 Devon Rd, Colonia, NJ 07067 and is currently estimated at $791,585, approximately $453 per square foot. 141 Devon Rd is a home located in Middlesex County with nearby schools including Lynn Crest Elementary School, Colonia Middle School, and Colonia High School.
Ownership History
Date
Name
Owned For
Owner Type
Purchase Details
Closed on
Aug 11, 2017
Sold by
Ventura Antonio A and Ventura Maria G
Bought by
Debrito Mariza Portela and Dacruz Andre Rodriguez
Current Estimated Value
Home Financials for this Owner
Home Financials are based on the most recent Mortgage that was taken out on this home.
Original Mortgage
$465,500
Interest Rate
3.89%
Mortgage Type
New Conventional
Create a Home Valuation Report for This Property
The Home Valuation Report is an in-depth analysis detailing your home's value as well as a comparison with similar homes in the area
Home Values in the Area
Average Home Value in this Area
Purchase History
| Date | Buyer | Sale Price | Title Company |
|---|---|---|---|
| Debrito Mariza Portela | $490,000 | None Available |
Source: Public Records
Mortgage History
| Date | Status | Borrower | Loan Amount |
|---|---|---|---|
| Previous Owner | Debrito Mariza Portela | $465,500 |
Source: Public Records
Tax History
| Year | Tax Paid | Tax Assessment Tax Assessment Total Assessment is a certain percentage of the fair market value that is determined by local assessors to be the total taxable value of land and additions on the property. | Land | Improvement |
|---|---|---|---|---|
| 2025 | $16,825 | $139,300 | $49,800 | $89,500 |
| 2024 | $16,465 | $139,300 | $49,800 | $89,500 |
Source: Public Records
Map
Nearby Homes
- 27 Eagle St
- 2 Maddie Ct
- 35 Warwick Rd
- 40 W Hill Rd
- 29 Park Ave
- 42 Harrow Dr
- 64 S Cliff Rd
- 19 Claudia St
- 47 Glendale Rd
- 145 Dover Rd
- 147 Warwick St
- 479 Chain O' Hills Rd
- 77 Union St
- 109 S Harrison Ave
- 21 Windsor Ln
- 188 Bloomfield Ave
- 990 Rebecca Place
- 53 Princeton Ave
- 1031 Woodruff St
- 124 Lincoln Ave
Your Personal Tour Guide
Ask me questions while you tour the home.