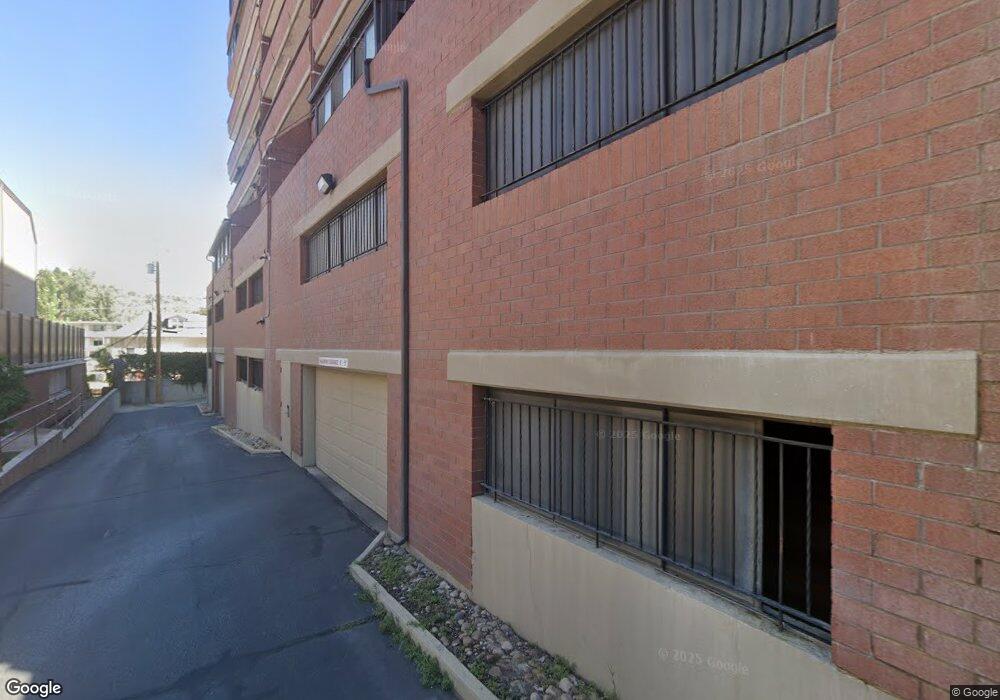
141 E 2nd Ave Unit 603 Salt Lake City, UT 84103
The Avenues NeighborhoodEstimated Value: $373,000 - $499,000
1
Bed
2
Baths
1,010
Sq Ft
$425/Sq Ft
Est. Value
About This Home
This home is located at 141 E 2nd Ave Unit 603, Salt Lake City, UT 84103 and is currently estimated at $429,154, approximately $424 per square foot. 141 E 2nd Ave Unit 603 is a home located in Salt Lake County with nearby schools including Ensign School, West High, and Open Classroom.
Ownership History
Date
Name
Owned For
Owner Type
Purchase Details
Closed on
Oct 30, 2018
Sold by
Broadbent William Hilton and Broadbent Sarah Bohan
Bought by
Brazley Michael
Current Estimated Value
Purchase Details
Closed on
Nov 9, 2004
Sold by
Bell M Shayne
Bought by
Broadbent William Hilton and Broadbent Sarah Bohan
Purchase Details
Closed on
May 5, 2001
Sold by
Bell M Shayne
Bought by
Odell Amy C
Purchase Details
Closed on
Jul 12, 1995
Sold by
Boyer Mark C
Bought by
Bell M Shayne
Home Financials for this Owner
Home Financials are based on the most recent Mortgage that was taken out on this home.
Original Mortgage
$105,000
Interest Rate
7.74%
Mortgage Type
FHA
Purchase Details
Closed on
Aug 26, 1994
Sold by
Le Forestier David and Le Forestier Victoria M
Bought by
Boyer Mark C
Home Financials for this Owner
Home Financials are based on the most recent Mortgage that was taken out on this home.
Original Mortgage
$60,000
Interest Rate
8.65%
Create a Home Valuation Report for This Property
The Home Valuation Report is an in-depth analysis detailing your home's value as well as a comparison with similar homes in the area
Home Values in the Area
Average Home Value in this Area
Purchase History
| Date | Buyer | Sale Price | Title Company |
|---|---|---|---|
| Brazley Michael | -- | North American Title Llc | |
| Broadbent William Hilton | -- | First American Title | |
| Odell Amy C | -- | -- | |
| Bell M Shayne | -- | First American Title | |
| Boyer Mark C | -- | -- |
Source: Public Records
Mortgage History
| Date | Status | Borrower | Loan Amount |
|---|---|---|---|
| Previous Owner | Bell M Shayne | $105,000 | |
| Previous Owner | Boyer Mark C | $60,000 |
Source: Public Records
Tax History Compared to Growth
Tax History
| Year | Tax Paid | Tax Assessment Tax Assessment Total Assessment is a certain percentage of the fair market value that is determined by local assessors to be the total taxable value of land and additions on the property. | Land | Improvement |
|---|---|---|---|---|
| 2025 | $1,666 | $339,700 | $101,900 | $237,800 |
| 2024 | $1,666 | $317,800 | $95,300 | $222,500 |
| 2023 | $1,604 | $295,000 | $88,500 | $206,500 |
| 2022 | $1,841 | $317,700 | $95,300 | $222,400 |
| 2021 | $2,034 | $288,800 | $86,600 | $202,200 |
| 2020 | $1,980 | $294,500 | $88,300 | $206,200 |
| 2019 | $1,983 | $277,400 | $83,200 | $194,200 |
| 2018 | $36 | $256,300 | $76,900 | $179,400 |
| 2017 | $561 | $240,500 | $72,100 | $168,400 |
| 2016 | $321 | $213,500 | $64,000 | $149,500 |
| 2015 | $5 | $203,200 | $60,900 | $142,300 |
| 2014 | $208 | $201,200 | $60,300 | $140,900 |
Source: Public Records
Map
Nearby Homes
- 152 E 3rd Ave
- 146 E 2nd Ave
- 123 E 2nd Ave Unit 505
- 123 E 2nd Ave Unit 502
- 131 E 1st Ave Unit 305
- 171 E 3rd Ave Unit 301
- 171 E 3rd Ave Unit 601
- 171 E 3rd Ave Unit 709
- 125 E 1st Ave Unit 206
- 158 N State St
- 86 B St E Unit 24
- 86 B St E Unit 10
- 240 N Spencer Ct
- 216 B St
- 29 S State St Unit 614
- 29 S State St Unit 501
- 29 S State St Unit 216
- 29 S State St Unit 317
- 265 E 5th Ave
- 8 E Hillside Ave Unit 103
- 141 E 2nd Ave Unit 803
- 141 E 2nd Ave Unit 406
- 141 E 2nd Ave Unit 801
- 141 E 2nd Ave Unit 704
- 141 E 2nd Ave Unit 702
- 141 E 2nd Ave Unit 506
- 141 E 2nd Ave Unit 504
- 141 E 2nd Ave Unit 805
- 141 E 2nd Ave Unit 901
- 141 E 2nd Ave Unit 401
- 141 E 2nd Ave Unit 305
- 141 E 2nd Ave Unit 501
- 141 E 2nd Ave Unit 505
- 141 E 2nd Ave Unit 503
- 141 E 2nd Ave Unit 606
- 141 E 2nd Ave Unit 701
- 141 E 2nd Ave Unit 703
- 141 E 2nd Ave Unit 405
- 141 E 2nd Ave Unit 601
- 141 E 2nd Ave Unit 602