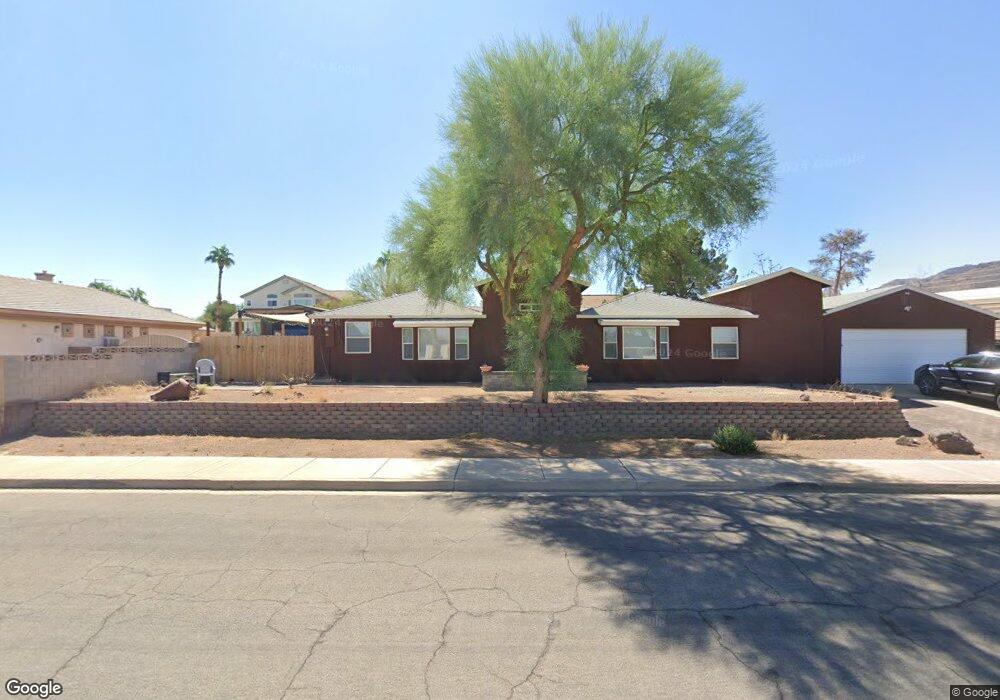
141 E Mulberry Dr Henderson, NV 89015
Black Mountain NeighborhoodEstimated Value: $567,909 - $811,000
5
Beds
3
Baths
2,938
Sq Ft
$230/Sq Ft
Est. Value
About This Home
This home is located at 141 E Mulberry Dr, Henderson, NV 89015 and is currently estimated at $674,727, approximately $229 per square foot. 141 E Mulberry Dr is a home located in Clark County with nearby schools including Ulis Newton Elementary School, Jack & Terry Mannion Middle School, and Foothill High School.
Ownership History
Date
Name
Owned For
Owner Type
Purchase Details
Closed on
Jul 2, 2015
Sold by
Kvykendall Ronald and Kvykendall Clay
Bought by
Kvykendall Clay and Riggs Megan
Current Estimated Value
Purchase Details
Closed on
Mar 20, 2006
Sold by
Kuykendall Ronald
Bought by
Kuykendall Ronald and Kuykendall Clay
Purchase Details
Closed on
May 12, 2004
Sold by
Kuykendall Martha O
Bought by
Kuykendall Ronald L
Home Financials for this Owner
Home Financials are based on the most recent Mortgage that was taken out on this home.
Original Mortgage
$128,100
Interest Rate
5.12%
Purchase Details
Closed on
Feb 12, 1996
Sold by
Kuykendall Ronald L and Kuykendall Kim
Bought by
Kuykendall Ronald L
Home Financials for this Owner
Home Financials are based on the most recent Mortgage that was taken out on this home.
Original Mortgage
$101,250
Interest Rate
7.19%
Create a Home Valuation Report for This Property
The Home Valuation Report is an in-depth analysis detailing your home's value as well as a comparison with similar homes in the area
Home Values in the Area
Average Home Value in this Area
Purchase History
| Date | Buyer | Sale Price | Title Company |
|---|---|---|---|
| Kvykendall Clay | -- | None Available | |
| Kuykendall Ronald | -- | None Available | |
| Kuykendall Ronald L | -- | Fidelity National Title | |
| Kuykendall Ronald L | -- | -- |
Source: Public Records
Mortgage History
| Date | Status | Borrower | Loan Amount |
|---|---|---|---|
| Previous Owner | Kuykendall Ronald L | $128,100 | |
| Previous Owner | Kuykendall Ronald L | $101,250 |
Source: Public Records
Tax History
| Year | Tax Paid | Tax Assessment Tax Assessment Total Assessment is a certain percentage of the fair market value that is determined by local assessors to be the total taxable value of land and additions on the property. | Land | Improvement |
|---|---|---|---|---|
| 2026 | $1,839 | $113,400 | $70,000 | $43,400 |
| 2025 | $1,785 | $110,270 | $66,500 | $43,770 |
| 2024 | $1,734 | $110,270 | $66,500 | $43,770 |
| 2023 | $1,734 | $96,680 | $56,000 | $40,680 |
| 2022 | $1,684 | $92,913 | $56,000 | $36,913 |
| 2021 | $1,635 | $83,885 | $49,000 | $34,885 |
| 2020 | $1,534 | $71,217 | $38,500 | $32,717 |
| 2019 | $1,516 | $66,988 | $35,000 | $31,988 |
| 2018 | $1,446 | $54,891 | $24,500 | $30,391 |
| 2017 | $1,595 | $55,025 | $24,500 | $30,525 |
| 2016 | $1,354 | $53,186 | $22,750 | $30,436 |
| 2015 | $1,351 | $45,647 | $15,750 | $29,897 |
| 2014 | $1,311 | $43,926 | $15,750 | $28,176 |
Source: Public Records
Map
Nearby Homes
- 120 E Rochell Dr
- 415 Blackridge Rd
- 622 E Fairway Rd
- 611 E Fairway Rd
- 230 W Rochell Dr
- 139 Aqua Commons Ln
- 601 Calcutta Ln
- 280 W Highland Dr
- 228 E van Wagenen St
- 116 Barclay Heights Ave
- 271 E Middleton Dr
- 211 Viewmont Dr
- 461 S Chesapeake Way
- 260 Waterwheel Falls Dr
- 200 E Kimberly Dr
- 301 E Longacres Dr
- 526 Crestway Rd
- 281 E Kimberly Dr
- 465 Annapolis Cir
- 121 E Rancho Dr
- 161 E Mulberry Dr
- 121 E Mulberry Dr
- 140 E Cypress Dr
- 160 E Cypress Dr
- 140 E Mulberry Dr
- 0 E Cypress Dr
- 181 E Mulberry Dr
- 101 E Mulberry Dr
- 101 E Mulberry Dr
- 180 E Cypress Dr
- 100 E Cypress Dr
- 424 Blackridge Rd
- 141 E Rochell Dr
- 141 E Cypress Dr
- 422 Blackridge Rd
- 438 Blackridge Rd
- 101 E Cypress Dr
- 431 Blackridge Rd
- 427 Blackridge Rd
Your Personal Tour Guide
Ask me questions while you tour the home.