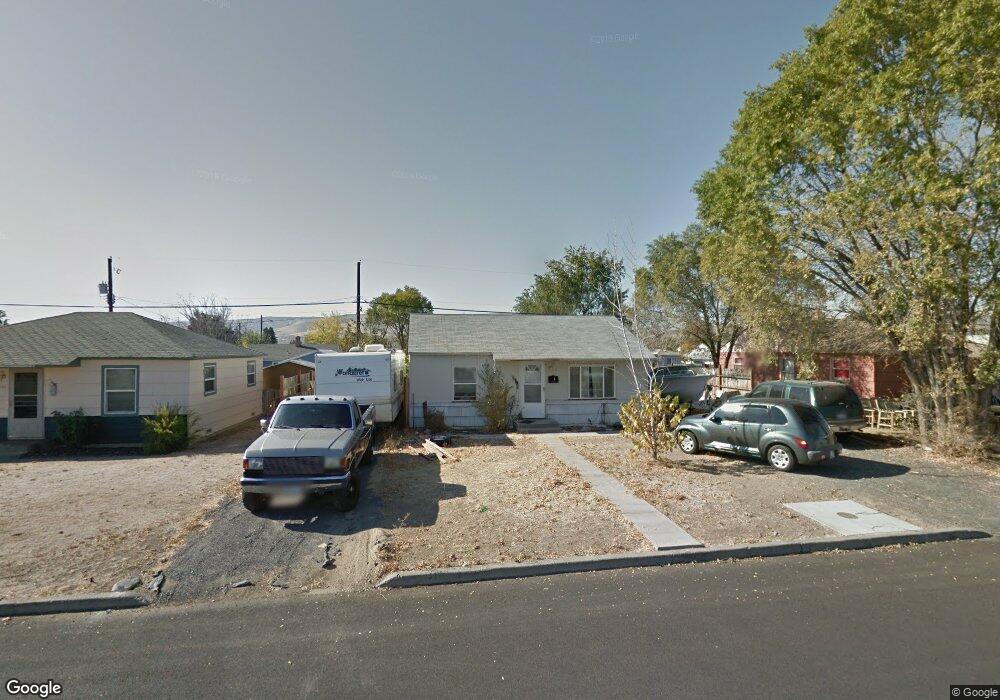
141 F St SE Ephrata, WA 98823
Estimated Value: $195,000 - $242,000
2
Beds
1
Bath
836
Sq Ft
$256/Sq Ft
Est. Value
About This Home
This home is located at 141 F St SE, Ephrata, WA 98823 and is currently estimated at $214,067, approximately $256 per square foot. 141 F St SE is a home located in Grant County with nearby schools including Ephrata High School, New Life Christian School, and St. Rose of Lima Catholic School.
Ownership History
Date
Name
Owned For
Owner Type
Purchase Details
Closed on
Mar 12, 2020
Sold by
Foster Laurie Kay and Estate Of Dawn L Morton
Bought by
Gillespie Julie Anne
Current Estimated Value
Purchase Details
Closed on
Aug 31, 2010
Sold by
Morton Eugene R
Bought by
Morton Dawn L
Purchase Details
Closed on
Jul 26, 2005
Sold by
Biladeau Lilah M and Biladeau Byron L
Bought by
Lebarron Christopher N and Lebarron Julie
Home Financials for this Owner
Home Financials are based on the most recent Mortgage that was taken out on this home.
Original Mortgage
$57,000
Interest Rate
7.5%
Mortgage Type
Fannie Mae Freddie Mac
Create a Home Valuation Report for This Property
The Home Valuation Report is an in-depth analysis detailing your home's value as well as a comparison with similar homes in the area
Home Values in the Area
Average Home Value in this Area
Purchase History
| Date | Buyer | Sale Price | Title Company |
|---|---|---|---|
| Gillespie Julie Anne | -- | None Available | |
| Morton Dawn L | -- | Chicago Title Ins Co | |
| Morton Dawn L | $82,000 | Chicago Title Ins Co | |
| Lebarron Christopher N | $57,000 | Security Title Guara |
Source: Public Records
Mortgage History
| Date | Status | Borrower | Loan Amount |
|---|---|---|---|
| Previous Owner | Lebarron Christopher N | $57,000 |
Source: Public Records
Tax History Compared to Growth
Tax History
| Year | Tax Paid | Tax Assessment Tax Assessment Total Assessment is a certain percentage of the fair market value that is determined by local assessors to be the total taxable value of land and additions on the property. | Land | Improvement |
|---|---|---|---|---|
| 2024 | $1,085 | $95,484 | $18,500 | $76,984 |
| 2023 | $1,188 | $81,060 | $18,500 | $62,560 |
| 2022 | $1,018 | $81,060 | $18,500 | $62,560 |
| 2021 | $911 | $81,060 | $18,500 | $62,560 |
| 2020 | $939 | $69,170 | $18,500 | $50,670 |
| 2019 | $726 | $67,795 | $18,500 | $49,295 |
| 2018 | $1,031 | $70,815 | $20,000 | $50,815 |
| 2017 | $991 | $72,630 | $20,000 | $52,630 |
| 2016 | $970 | $65,925 | $20,000 | $45,925 |
| 2013 | -- | $68,030 | $20,000 | $48,030 |
Source: Public Records
Map
Nearby Homes