

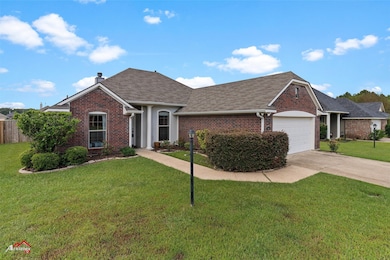


141 Fitzwilliam St Haughton, LA 71037
Estimated payment $1,436/month
Total Views
10,802
3
Beds
2
Baths
1,437
Sq Ft
$174
Price per Sq Ft
Highlights
- Popular Property
- Open Floorplan
- Covered Patio or Porch
- T.L. Rodes Elementary School Rated A-
- Wood Flooring
- Attached Garage
About This Home
This home is located at 141 Fitzwilliam St, Haughton, LA 71037 and is currently priced at $250,000, approximately $173 per square foot. This property was built in 2008. 141 Fitzwilliam St is a home located in Bossier Parish with nearby schools including T.L. Rodes Elementary School, Princeton Elementary School, and Platt Elementary School.
Listing Agent
Coldwell Banker Apex, REALTORS Brokerage Phone: 318-747-5411 License #0995715307 Listed on: 09/29/2025
Home Details
Home Type
- Single Family
Est. Annual Taxes
- $1,414
Year Built
- Built in 2008
Home Design
- Brick Exterior Construction
- Slab Foundation
- Shingle Roof
Interior Spaces
- 1,437 Sq Ft Home
- 1-Story Property
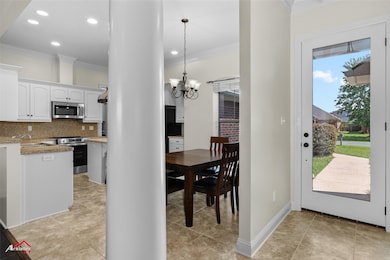
- Open Floorplan
- Ceiling Fan
- Gas Log Fireplace
- Living Room with Fireplace
Kitchen
- Electric Oven
- Electric Cooktop
- Microwave
- Dishwasher
- Kitchen Island
Flooring
- Wood
- Carpet
- Tile
Bedrooms and Bathrooms
- 3 Bedrooms
- 2 Full Bathrooms
Parking
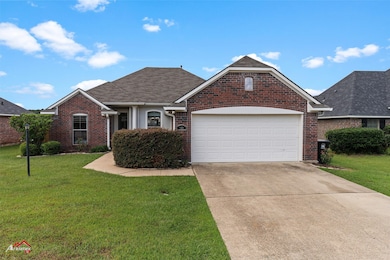
- Attached Garage
- Front Facing Garage
- Single Garage Door
- Garage Door Opener
Schools
- Bossier Isd Schools Elementary School
- Bossier Isd Schools High School
Utilities
- Central Heating and Cooling System
- Heating System Uses Natural Gas
- High Speed Internet
- Phone Available
- Cable TV Available
Additional Features
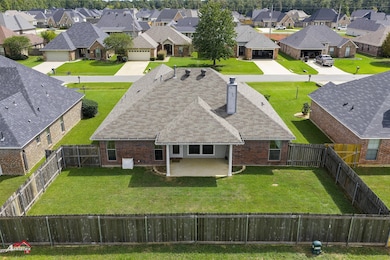
- Covered Patio or Porch
- 6,820 Sq Ft Lot
Community Details
- Tuscany Villas 02 Subdivision
Listing and Financial Details
- Tax Lot 36
- Assessor Parcel Number 165740
Map
Create a Home Valuation Report for This Property
The Home Valuation Report is an in-depth analysis detailing your home's value as well as a comparison with similar homes in the area
Home Values in the Area
Average Home Value in this Area
Tax History
| Year | Tax Paid | Tax Assessment Tax Assessment Total Assessment is a certain percentage of the fair market value that is determined by local assessors to be the total taxable value of land and additions on the property. | Land | Improvement |
|---|---|---|---|---|
| 2024 | $1,664 | $21,805 | $3,200 | $18,605 |
| 2023 | $1,080 | $15,633 | $2,500 | $13,133 |
| 2022 | $1,075 | $15,633 | $2,500 | $13,133 |
| 2021 | $1,075 | $15,633 | $2,500 | $13,133 |
| 2020 | $871 | $15,633 | $2,500 | $13,133 |
| 2019 | $876 | $15,560 | $2,500 | $13,060 |
| 2018 | $876 | $15,560 | $2,500 | $13,060 |
| 2017 | $1,070 | $15,560 | $2,500 | $13,060 |
| 2016 | $1,070 | $15,560 | $2,500 | $13,060 |
| 2015 | $1,020 | $15,620 | $2,500 | $13,120 |
| 2014 | $1,020 | $15,620 | $2,500 | $13,120 |
Source: Public Records
Property History
| Date | Event | Price | List to Sale | Price per Sq Ft |
|---|---|---|---|---|
| 09/29/2025 09/29/25 | For Sale | $250,000 | -- | $174 / Sq Ft |
Source: North Texas Real Estate Information Systems (NTREIS)
Purchase History
| Date | Type | Sale Price | Title Company |
|---|---|---|---|
| Deed | $175,000 | None Available | |
| Deed | $157,000 | None Available | |
| Cash Sale Deed | $29,000 | None Available |
Source: Public Records
Mortgage History
| Date | Status | Loan Amount | Loan Type |
|---|---|---|---|
| Open | $170,563 | FHA | |
| Previous Owner | $167,346 | Unknown |
Source: Public Records
About the Listing Agent
Karla's Other Listings
Source: North Texas Real Estate Information Systems (NTREIS)
MLS Number: 21072370
APN: 165740
Disclaimer: Certain information contained herein is derived from information provided by parties other than Homes.com. All information provided is deemed reliable, but is not guaranteed to be accurate and should be independently verified.
![]() Listing information provided in part by the North Texas Real Estate Information Systems, Inc, for personal, non-commercial use by viewers of this site and may not be reproduced or redistributed. All information is deemed reliable but not guaranteed. Copyright © NTREIS 2025. All rights reserved
Listing information provided in part by the North Texas Real Estate Information Systems, Inc, for personal, non-commercial use by viewers of this site and may not be reproduced or redistributed. All information is deemed reliable but not guaranteed. Copyright © NTREIS 2025. All rights reserved
Nearby Homes
- 144 Fitzwilliam St
- 254 Sedgewick Ave
- 364 Camden Hill
- 10 Forsythe Blvd
- 375 Camden Hill St
- 320 N Hampton St
- 305 Camden Hill St
- 0 Allen Town Rd
- 00 Allen Town Rd
- 615 Aubrey Walk
- 552 Brunswick Gardens
- 115 Ashwood Dr
- 544 Pebble Dr
- 229 Marble Place
- 451 N Hazel St
- 621 Freedom St
- 333 Ace St
- 7709A U S 80
- 7709 U S 80
- 100 Maplewood Dr
- 256 Sedgewick Ave
- 23 Peaceful Pines Dr
- 716 Humphrey Dr
- 4570 U S 80
- 4542 Pine Crest Dr
- 514 Fox Cove
- 513 Fox Cove
- 2213 Washburn Way
- 2404 Stockwell Rd
- 2050 Stockwell Rd Unit 4
- 2175 Stockwell Rd
- 2020 Valley View Cir
- 508 Long Acre Dr
- 522 Long Acre Dr
- 5200 E Texas St
- 26 Venecia Ct
- 249 Arrowhead Dr
- 4804 Birdwell Ln
- 1300 Meadowview Dr
- 612 Bloomington Ln