Estimated Value: $247,000 - $270,000
4
Beds
2
Baths
1,457
Sq Ft
$177/Sq Ft
Est. Value
About This Home
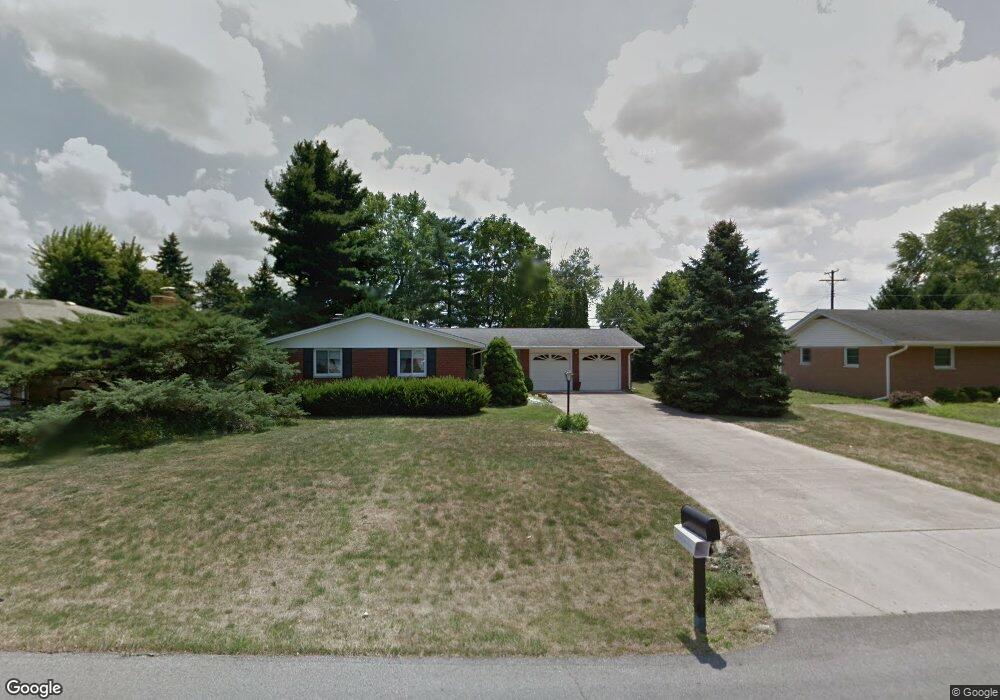
This home is located at 141 Hardacre Dr, Xenia, OH 45385 and is currently estimated at $258,604, approximately $177 per square foot. 141 Hardacre Dr is a home located in Greene County with nearby schools including Xenia High School, Summit Academy Community School for Alternative Learners - Xenia, and Legacy Christian Academy.
Ownership History
Date
Name
Owned For
Owner Type
Purchase Details
Closed on
May 16, 2023
Sold by
Sturgeon Robert P
Bought by
Sturgeon Bonnie L
Current Estimated Value
Purchase Details
Closed on
Jul 17, 2017
Sold by
Harkleroad Andrea
Bought by
Sturgeon Robert P and Sturgeon Bonnie L
Home Financials for this Owner
Home Financials are based on the most recent Mortgage that was taken out on this home.
Original Mortgage
$95,600
Interest Rate
3.91%
Mortgage Type
New Conventional
Purchase Details
Closed on
Dec 29, 2016
Bought by
Harkleroad Rea Successor Trustee
Purchase Details
Closed on
Jun 27, 2001
Sold by
Holfield Arthur W and Holfield Edythe M
Bought by
Holfield Arthur W and Holfield Edythe M
Create a Home Valuation Report for This Property
The Home Valuation Report is an in-depth analysis detailing your home's value as well as a comparison with similar homes in the area
Home Values in the Area
Average Home Value in this Area
Purchase History
| Date | Buyer | Sale Price | Title Company |
|---|---|---|---|
| Sturgeon Bonnie L | -- | None Listed On Document | |
| Sturgeon Robert P | $127,300 | None Available | |
| Harkleroad Rea Successor Trustee | -- | -- | |
| Holfield Arthur W | -- | -- |
Source: Public Records
Mortgage History
| Date | Status | Borrower | Loan Amount |
|---|---|---|---|
| Previous Owner | Sturgeon Robert P | $95,600 |
Source: Public Records
Tax History
| Year | Tax Paid | Tax Assessment Tax Assessment Total Assessment is a certain percentage of the fair market value that is determined by local assessors to be the total taxable value of land and additions on the property. | Land | Improvement |
|---|---|---|---|---|
| 2025 | $2,618 | $64,860 | $12,730 | $52,130 |
| 2024 | $2,618 | $64,860 | $12,730 | $52,130 |
| 2023 | $2,611 | $64,860 | $12,730 | $52,130 |
| 2022 | $2,085 | $48,630 | $10,610 | $38,020 |
| 2021 | $2,641 | $48,630 | $10,610 | $38,020 |
| 2020 | $2,538 | $48,630 | $10,610 | $38,020 |
| 2019 | $2,030 | $36,520 | $9,510 | $27,010 |
| 2018 | $2,038 | $36,520 | $9,510 | $27,010 |
| 2017 | $1,402 | $36,520 | $9,510 | $27,010 |
| 2016 | $1,402 | $34,140 | $9,510 | $24,630 |
| 2015 | $703 | $34,140 | $9,510 | $24,630 |
| 2014 | $674 | $34,140 | $9,510 | $24,630 |
Source: Public Records
Map
Nearby Homes
- 1038 Lark Ln
- 1809 Palmer Ct
- 1044 Whitestone Rd
- 1556 N Regency Dr
- 955 Oak Dale Dr
- 1461 Pavey Place
- 167 Beverly Place
- 1785 Tahoe Dr
- 1359 Eagles Way
- 634 Martin Dr
- 289 Hollywood Blvd
- 2096 Sierra Trail
- 2255 Monterey Dr
- 179 Omalee Dr
- 453 Hollywood Blvd
- 461 Hollywood Blvd
- 1030 Independence Dr
- 1785 Palmer Ct
- 1796 Palmer Ct
- 1790 Palmer Ct
- 151 Hardacre Dr
- 131 Hardacre Dr
- 140 Kinsey Rd
- 150 Kinsey Rd
- 130 Kinsey Rd
- 161 Hardacre Dr
- 121 Hardacre Dr
- 130 Hardacre Dr
- 120 Kinsey Rd
- 1026 Trianon Dr
- 118 Hardacre Dr
- 1001 Yellowstone Rd
- 1031 Trianon Dr
- 111 Hardacre Dr
- 170 Kinsey Rd
- 110 Kinsey Rd
- 1026 Lark Ln
- 1021 Yellowstone Rd
- 1032 Trianon Dr
- 101 Hardacre Dr
Your Personal Tour Guide
Ask me questions while you tour the home.