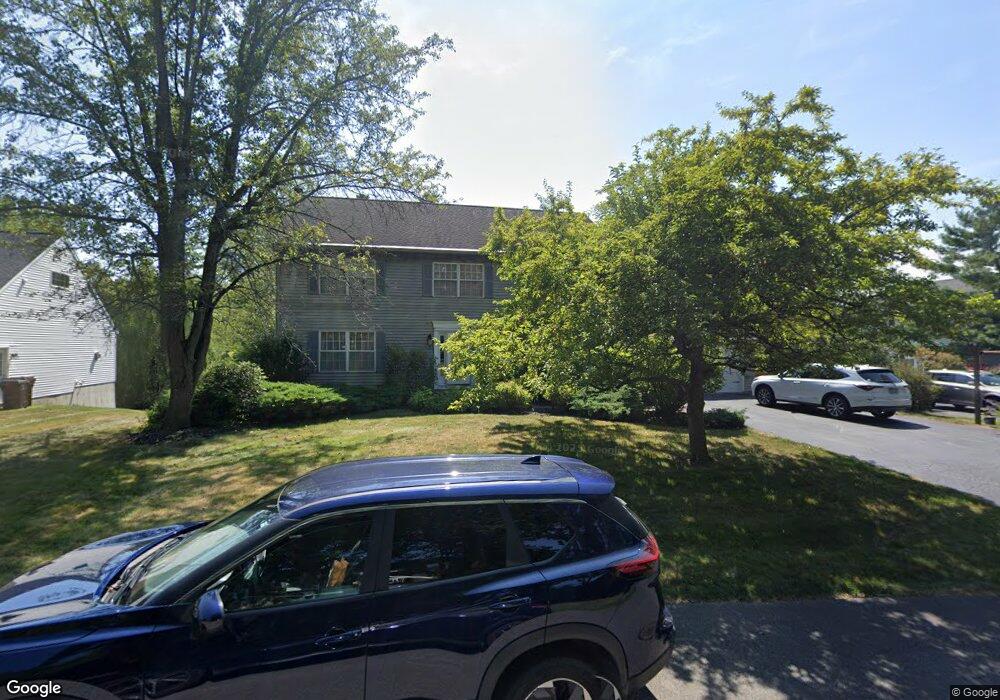
141 Jordan Blvd Delmar, NY 12054
Estimated Value: $596,566 - $718,000
4
Beds
3
Baths
2,562
Sq Ft
$252/Sq Ft
Est. Value
About This Home
This home is located at 141 Jordan Blvd, Delmar, NY 12054 and is currently estimated at $646,642, approximately $252 per square foot. 141 Jordan Blvd is a home located in Albany County with nearby schools including St. Thomas the Apostle School and Mt. Moriah Academy.
Ownership History
Date
Name
Owned For
Owner Type
Purchase Details
Closed on
Mar 31, 2010
Sold by
Horgan Michael
Bought by
Horgan Michael and Brilling Jaclyn A
Current Estimated Value
Purchase Details
Closed on
Oct 14, 2008
Sold by
Horgan Michael
Bought by
Horgan Michael
Home Financials for this Owner
Home Financials are based on the most recent Mortgage that was taken out on this home.
Original Mortgage
$316,406
Interest Rate
5.83%
Mortgage Type
FHA
Create a Home Valuation Report for This Property
The Home Valuation Report is an in-depth analysis detailing your home's value as well as a comparison with similar homes in the area
Home Values in the Area
Average Home Value in this Area
Purchase History
| Date | Buyer | Sale Price | Title Company |
|---|---|---|---|
| Horgan Michael | -- | None Available | |
| Horgan Michael | -- | -- |
Source: Public Records
Mortgage History
| Date | Status | Borrower | Loan Amount |
|---|---|---|---|
| Closed | Horgan Michael | $316,406 |
Source: Public Records
Tax History Compared to Growth
Tax History
| Year | Tax Paid | Tax Assessment Tax Assessment Total Assessment is a certain percentage of the fair market value that is determined by local assessors to be the total taxable value of land and additions on the property. | Land | Improvement |
|---|---|---|---|---|
| 2024 | $11,561 | $351,400 | $68,500 | $282,900 |
| 2023 | $11,255 | $351,400 | $68,500 | $282,900 |
| 2022 | $19,593 | $351,400 | $68,500 | $282,900 |
| 2021 | $19,670 | $351,400 | $68,500 | $282,900 |
| 2020 | $11,032 | $351,400 | $68,500 | $282,900 |
| 2019 | $9,565 | $351,400 | $68,500 | $282,900 |
| 2018 | $10,847 | $351,400 | $68,500 | $282,900 |
| 2017 | $10,644 | $351,400 | $68,500 | $282,900 |
| 2016 | $10,644 | $351,400 | $68,500 | $282,900 |
| 2015 | -- | $351,400 | $68,500 | $282,900 |
| 2014 | -- | $351,400 | $68,500 | $282,900 |
Source: Public Records
Map
Nearby Homes