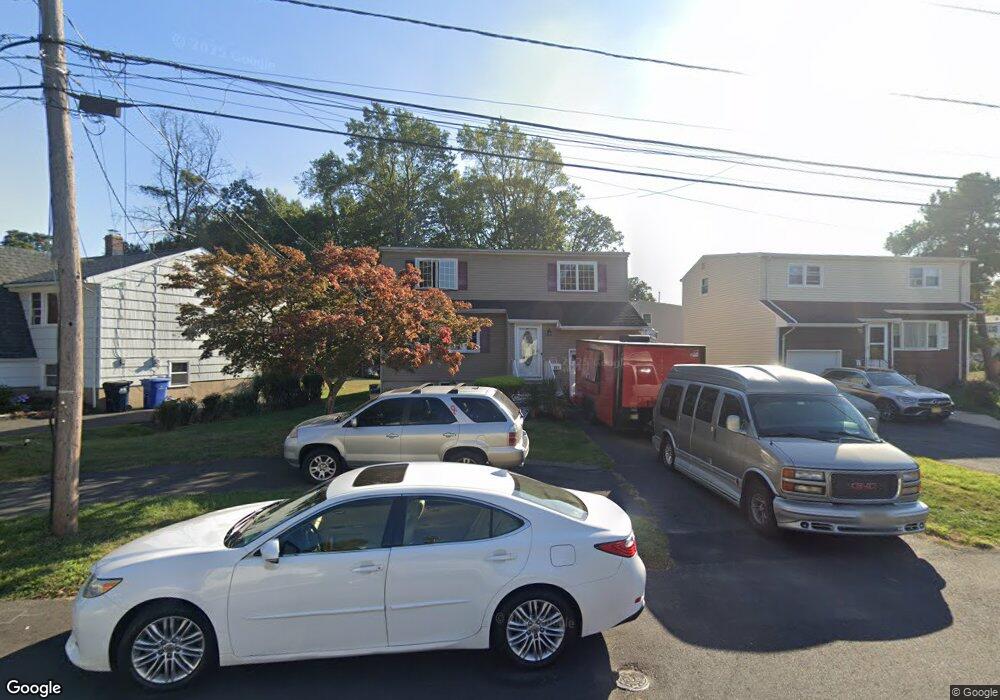
141 Kline Place Dunellen, NJ 08812
Estimated Value: $487,923 - $611,000
Studio
--
Bath
1,510
Sq Ft
$361/Sq Ft
Est. Value
About This Home
This home is located at 141 Kline Place, Dunellen, NJ 08812 and is currently estimated at $545,231, approximately $361 per square foot. 141 Kline Place is a home located in Middlesex County with nearby schools including John P. Faber Elementary School, Lincoln Middle School, and Dunellen High School.
Ownership History
Date
Name
Owned For
Owner Type
Purchase Details
Closed on
Mar 15, 2002
Sold by
Khan Ricardo
Bought by
Scales Raishawn
Current Estimated Value
Home Financials for this Owner
Home Financials are based on the most recent Mortgage that was taken out on this home.
Original Mortgage
$173,000
Outstanding Balance
$70,420
Interest Rate
6.84%
Estimated Equity
$474,811
Purchase Details
Closed on
Mar 30, 2001
Sold by
Collins Frederick
Bought by
Kahn Richard and Khan Randi
Home Financials for this Owner
Home Financials are based on the most recent Mortgage that was taken out on this home.
Original Mortgage
$150,220
Interest Rate
7.05%
Mortgage Type
FHA
Purchase Details
Closed on
Jan 25, 2001
Sold by
Hud
Bought by
Collins Frederick and Collins Maryann
Home Financials for this Owner
Home Financials are based on the most recent Mortgage that was taken out on this home.
Original Mortgage
$113,400
Interest Rate
7.14%
Create a Home Valuation Report for This Property
The Home Valuation Report is an in-depth analysis detailing your home's value as well as a comparison with similar homes in the area
Home Values in the Area
Average Home Value in this Area
Purchase History
| Date | Buyer | Sale Price | Title Company |
|---|---|---|---|
| Scales Raishawn | $183,000 | -- | |
| Kahn Richard | $158,000 | -- | |
| Collins Frederick | $126,000 | -- |
Source: Public Records
Mortgage History
| Date | Status | Borrower | Loan Amount |
|---|---|---|---|
| Open | Scales Raishawn | $173,000 | |
| Previous Owner | Kahn Richard | $150,220 | |
| Previous Owner | Collins Frederick | $113,400 |
Source: Public Records
Tax History Compared to Growth
Tax History
| Year | Tax Paid | Tax Assessment Tax Assessment Total Assessment is a certain percentage of the fair market value that is determined by local assessors to be the total taxable value of land and additions on the property. | Land | Improvement |
|---|---|---|---|---|
| 2025 | $11,120 | $455,000 | $99,300 | $355,700 |
| 2024 | $9,454 | $443,400 | $99,300 | $344,100 |
| 2023 | $9,454 | $349,100 | $99,300 | $249,800 |
| 2022 | $9,937 | $359,900 | $99,300 | $260,600 |
| 2021 | $9,033 | $361,500 | $99,300 | $262,200 |
| 2020 | $9,455 | $291,100 | $95,600 | $195,500 |
| 2019 | $9,033 | $291,100 | $95,600 | $195,500 |
| 2018 | $8,414 | $62,300 | $18,900 | $43,400 |
| 2017 | $8,074 | $62,300 | $18,900 | $43,400 |
| 2016 | $7,779 | $62,300 | $18,900 | $43,400 |
| 2015 | $7,586 | $62,300 | $18,900 | $43,400 |
| 2014 | $7,425 | $62,300 | $18,900 | $43,400 |
Source: Public Records
Map
Nearby Homes
- 118 Jadach Dr
- 1809 W 4th St
- 228 Park Ln
- 227 Park Ln
- 241 Orange St
- 203 S Washington Ave
- 1775 W 5th St
- 1718 W 4th St
- 1758 S 2nd St
- 250 Whittier Ave
- 1825 Brunella Ave
- 12 Jefferson Ave
- 307 Rock Ave
- 1762 S 2nd St
- 400 Whittier Ave
- 423 New Market Rd
- 1621 Albert St
- 405 Wall St
- 1515 Dogwood Dr
- 1620 Quincy St