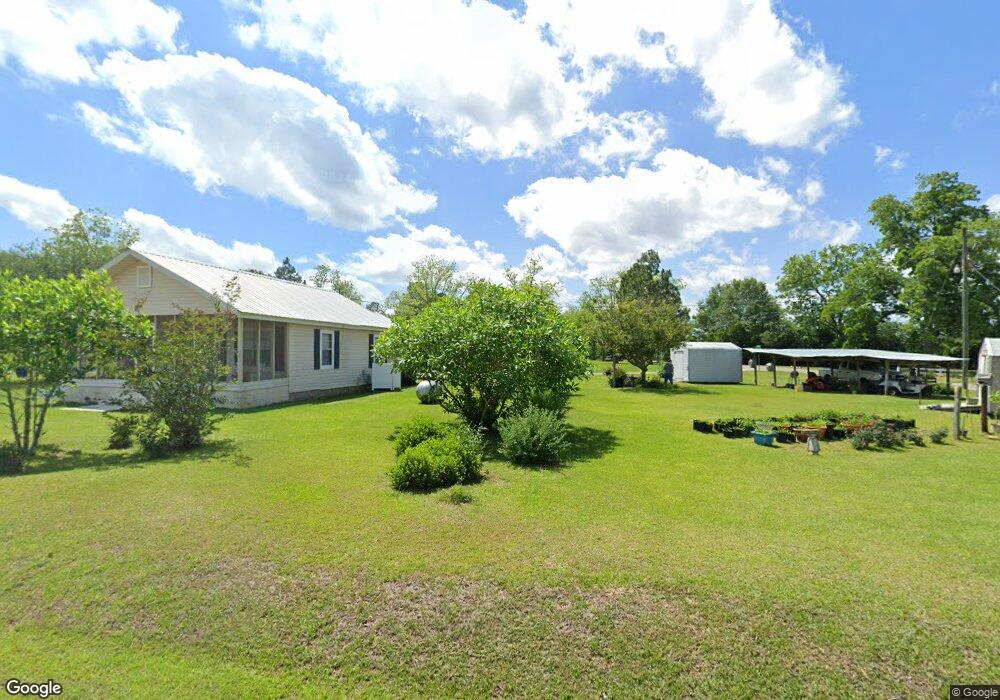
141 Main St Barwick, GA 31720
Estimated Value: $114,000 - $146,116
Studio
--
Bath
1,360
Sq Ft
$98/Sq Ft
Est. Value
About This Home
This home is located at 141 Main St, Barwick, GA 31720 and is currently estimated at $133,279, approximately $97 per square foot. 141 Main St is a home with nearby schools including North Brooks Elementary School.
Ownership History
Date
Name
Owned For
Owner Type
Purchase Details
Closed on
Feb 18, 2014
Sold by
Mitchell Mary M
Bought by
Stokes Susan L
Current Estimated Value
Home Financials for this Owner
Home Financials are based on the most recent Mortgage that was taken out on this home.
Original Mortgage
$63,822
Outstanding Balance
$48,113
Interest Rate
4.43%
Mortgage Type
FHA
Estimated Equity
$85,166
Purchase Details
Closed on
Aug 20, 2007
Sold by
Mitchell Jerry O and Mitchell Anna T
Bought by
Mitchell Mary M
Purchase Details
Closed on
Jul 23, 1997
Sold by
Beldon William and Beldon Emily M
Bought by
Mitchell Jerry O and Mitchell Anna T
Purchase Details
Closed on
Oct 2, 1989
Sold by
Mitchell Mitchell M and Mitchell Cynthia
Bought by
Beldon William and Beldon Emily M
Purchase Details
Closed on
Aug 20, 1984
Sold by
Selph Russell
Bought by
Mitchell Mitchell M and Mitchell Cynthia
Purchase Details
Closed on
Jun 7, 1983
Sold by
Baker Baker J and Baker Kay R
Bought by
Selph Russell
Create a Home Valuation Report for This Property
The Home Valuation Report is an in-depth analysis detailing your home's value as well as a comparison with similar homes in the area
Purchase History
| Date | Buyer | Sale Price | Title Company |
|---|---|---|---|
| Stokes Susan L | $65,000 | -- | |
| Mitchell Mary M | -- | -- | |
| Mitchell Mary M | -- | -- | |
| Mitchell Jerry O | $37,400 | -- | |
| Beldon William | $6,000 | -- | |
| Mitchell Mitchell M | -- | -- | |
| Selph Russell | -- | -- | |
| Baker Baker J | -- | -- |
Source: Public Records
Mortgage History
| Date | Status | Borrower | Loan Amount |
|---|---|---|---|
| Open | Mitchell Mary M | $63,822 | |
| Closed | Stokes Susan L | $63,822 |
Source: Public Records
Tax History
| Year | Tax Paid | Tax Assessment Tax Assessment Total Assessment is a certain percentage of the fair market value that is determined by local assessors to be the total taxable value of land and additions on the property. | Land | Improvement |
|---|---|---|---|---|
| 2025 | $1,863 | $45,080 | $7,280 | $37,800 |
| 2024 | $1,764 | $42,440 | $4,840 | $37,600 |
| 2023 | $1,205 | $38,000 | $4,840 | $33,160 |
| 2022 | $1,104 | $31,240 | $4,800 | $26,440 |
| 2021 | $931 | $26,296 | $1,760 | $24,536 |
| 2020 | $1,117 | $26,708 | $1,760 | $24,948 |
| 2019 | $865 | $25,600 | $1,800 | $23,800 |
| 2018 | $1,127 | $26,160 | $1,800 | $24,360 |
| 2017 | $873 | $25,520 | $1,800 | $23,720 |
| 2016 | $882 | $26,080 | $1,800 | $24,280 |
| 2015 | -- | $28,356 | $1,800 | $26,556 |
| 2014 | -- | $28,716 | $1,800 | $26,916 |
| 2013 | -- | $28,716 | $1,800 | $26,916 |
Source: Public Records
Map
Nearby Homes
- 800 Clifford St
- 1038-BA Church St
- 2195 Coffee Rd
- 7402 Coffee Rd
- 431 Dry Lake Rd
- 9900 Ozell Rd
- 4265 Howard Rd
- 0000 0000 Ozell Road (15+ - Acres)
- 1065 W Harris St
- 581 Harris St
- 2773 Georgia 33
- 56 Egypt Rd Unit 10
- 0 Ozell Rd Unit 26629849
- 111 Nicole Britt Dr
- 106 Nicole Britt Dr
- 101 Bailey Cir
- 201 Bailey Cir
- 00000 Austin Lane (3 46 Acres)
- 536 N Leaphart St
- 8447 Airline Rd
Your Personal Tour Guide
Ask me questions while you tour the home.