Estimated Value: $314,000 - $334,107
4
Beds
2
Baths
2,016
Sq Ft
$161/Sq Ft
Est. Value
About This Home
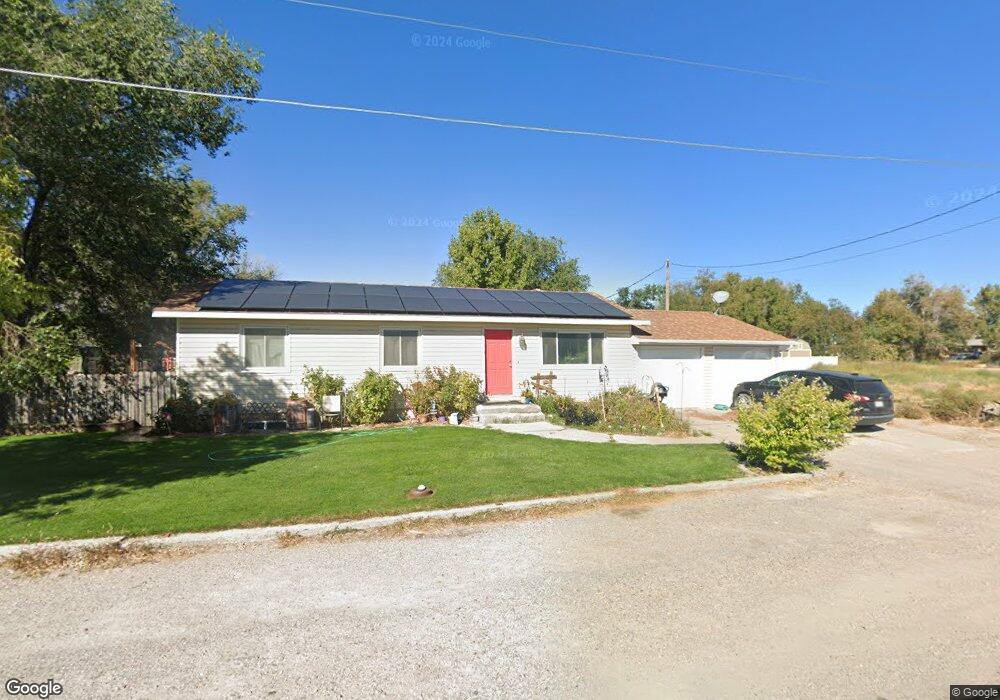
This home is located at 141 N 350 E, Delta, UT 84624 and is currently estimated at $324,777, approximately $161 per square foot. 141 N 350 E is a home located in Millard County with nearby schools including Cba Center and White River Academy.
Ownership History
Date
Name
Owned For
Owner Type
Purchase Details
Closed on
May 11, 2021
Sold by
Moody Casey D
Bought by
Moody Casey D
Current Estimated Value
Home Financials for this Owner
Home Financials are based on the most recent Mortgage that was taken out on this home.
Original Mortgage
$149,000
Outstanding Balance
$134,456
Interest Rate
3.1%
Mortgage Type
New Conventional
Estimated Equity
$190,321
Purchase Details
Closed on
Sep 24, 2010
Sold by
Miller David L and Miller Samantha E
Bought by
Moody Casey D
Home Financials for this Owner
Home Financials are based on the most recent Mortgage that was taken out on this home.
Original Mortgage
$143,005
Interest Rate
4.28%
Mortgage Type
New Conventional
Purchase Details
Closed on
Dec 29, 2004
Sold by
Bronson Sheldon
Bought by
Miller David L and Miller Samantha E
Home Financials for this Owner
Home Financials are based on the most recent Mortgage that was taken out on this home.
Original Mortgage
$80,000
Interest Rate
5.7%
Mortgage Type
New Conventional
Create a Home Valuation Report for This Property
The Home Valuation Report is an in-depth analysis detailing your home's value as well as a comparison with similar homes in the area
Home Values in the Area
Average Home Value in this Area
Purchase History
| Date | Buyer | Sale Price | Title Company |
|---|---|---|---|
| Moody Casey D | -- | First American Equity Loan S | |
| Moody Casey D | -- | -- | |
| Miller David L | -- | First American Title Insuran |
Source: Public Records
Mortgage History
| Date | Status | Borrower | Loan Amount |
|---|---|---|---|
| Open | Moody Casey D | $149,000 | |
| Closed | Moody Casey D | $143,005 | |
| Previous Owner | Miller David L | $80,000 |
Source: Public Records
Tax History
| Year | Tax Paid | Tax Assessment Tax Assessment Total Assessment is a certain percentage of the fair market value that is determined by local assessors to be the total taxable value of land and additions on the property. | Land | Improvement |
|---|---|---|---|---|
| 2025 | $1,424 | $152,225 | $18,219 | $134,006 |
| 2024 | $1,424 | $128,088 | $13,074 | $115,014 |
| 2023 | $1,600 | $128,088 | $13,074 | $115,014 |
| 2022 | $1,230 | $92,511 | $13,668 | $78,843 |
| 2021 | $1,041 | $74,697 | $10,335 | $64,362 |
| 2020 | $968 | $69,064 | $9,395 | $59,669 |
| 2019 | $906 | $64,695 | $8,699 | $55,996 |
| 2018 | $835 | $60,071 | $8,699 | $51,372 |
| 2017 | $863 | $59,818 | $8,446 | $51,372 |
| 2016 | $836 | $59,818 | $8,446 | $51,372 |
| 2015 | $835 | $59,818 | $8,446 | $51,372 |
| 2014 | -- | $59,568 | $8,461 | $51,107 |
| 2013 | -- | $59,568 | $8,461 | $51,107 |
Source: Public Records
Map
Nearby Homes
- 445 Topaz Blvd Unit 10
- 7900 E 250 Rd N
- 44 E 300 S
- 0 E Highway 6 Unit LotWP001 16586023
- 87 S 300 East Rd
- 321 E 200 S
- 520 E 450 North Rd
- 628 Sunset St
- Locust Ave Unit LotWP001
- 325 N 100 W
- 38 E 300 S
- 32 E 300 S
- 163 W 100 S
- 901 E 750 Rd N
- 341 W 100 S
- 294 S 300 W
- 451 W 300 N
- 98 W 1000 N
- 700 N Highway 6
- 2595 E 500 Rd S Unit 3
Your Personal Tour Guide
Ask me questions while you tour the home.