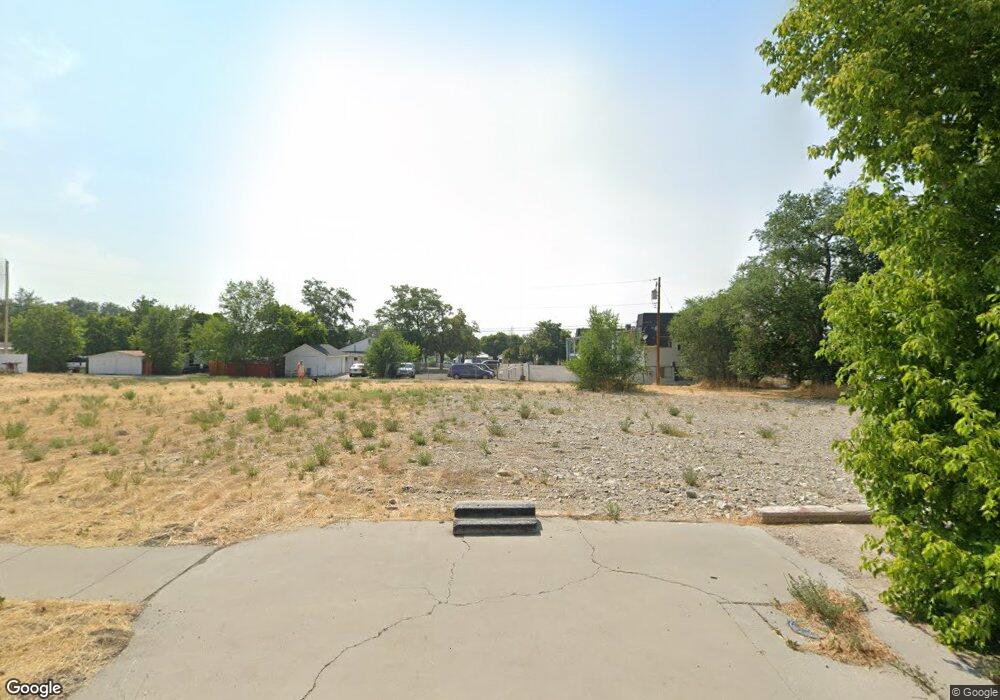
141 N Broadway St Tooele, UT 84074
Estimated Value: $328,391 - $565,000
--
Bed
--
Bath
2,025
Sq Ft
$219/Sq Ft
Est. Value
About This Home
This home is located at 141 N Broadway St, Tooele, UT 84074 and is currently estimated at $442,848, approximately $218 per square foot. 141 N Broadway St is a home located in Tooele County with nearby schools including Sterling Elementary School, Tooele Junior High School, and Tooele High School.
Ownership History
Date
Name
Owned For
Owner Type
Purchase Details
Closed on
Jun 26, 2020
Sold by
Broadway Heritage Apartments I Lp
Bought by
Americawest Investments Llc
Current Estimated Value
Home Financials for this Owner
Home Financials are based on the most recent Mortgage that was taken out on this home.
Original Mortgage
$316,800
Outstanding Balance
$281,439
Interest Rate
3.2%
Mortgage Type
Unknown
Estimated Equity
$161,409
Purchase Details
Closed on
Sep 25, 2007
Sold by
Natioanl Note Of Utah Lc
Bought by
Brodway Heritate Aprtments I Lp
Create a Home Valuation Report for This Property
The Home Valuation Report is an in-depth analysis detailing your home's value as well as a comparison with similar homes in the area
Home Values in the Area
Average Home Value in this Area
Purchase History
| Date | Buyer | Sale Price | Title Company |
|---|---|---|---|
| Americawest Investments Llc | -- | Advanced Title | |
| Brodway Heritate Aprtments I Lp | -- | Security Title |
Source: Public Records
Mortgage History
| Date | Status | Borrower | Loan Amount |
|---|---|---|---|
| Open | Americawest Investments Llc | $316,800 |
Source: Public Records
Tax History Compared to Growth
Tax History
| Year | Tax Paid | Tax Assessment Tax Assessment Total Assessment is a certain percentage of the fair market value that is determined by local assessors to be the total taxable value of land and additions on the property. | Land | Improvement |
|---|---|---|---|---|
| 2025 | $314 | $23,970 | $23,970 | $0 |
| 2024 | $314 | $23,970 | $23,970 | $0 |
| 2023 | $314 | $22,020 | $22,020 | $0 |
| 2022 | $1,095 | $94,220 | $81,720 | $12,500 |
| 2021 | $593 | $42,688 | $32,688 | $10,000 |
| 2020 | $622 | $42,688 | $32,688 | $10,000 |
| 2019 | $632 | $42,688 | $32,688 | $10,000 |
| 2018 | $703 | $45,000 | $35,000 | $10,000 |
| 2017 | $592 | $45,000 | $35,000 | $10,000 |
| 2016 | $673 | $48,931 | $30,096 | $18,835 |
| 2015 | $673 | $48,931 | $0 | $0 |
| 2014 | -- | $48,931 | $0 | $0 |
Source: Public Records
Map
Nearby Homes