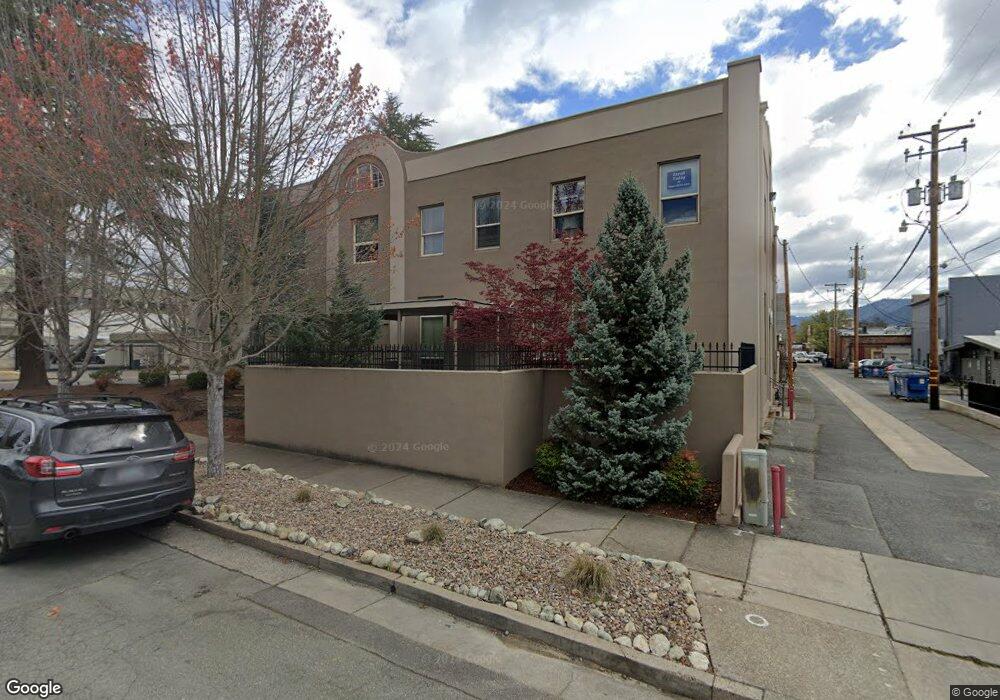
141 NW C St Grants Pass, OR 97526
Estimated Value: $1,173,042
--
Bed
2
Baths
8,000
Sq Ft
$147/Sq Ft
Est. Value
About This Home
This home is located at 141 NW C St, Grants Pass, OR 97526 and is currently estimated at $1,173,042, approximately $146 per square foot. 141 NW C St is a home located in Josephine County with nearby schools including Highland Elementary School, North Middle School, and Grants Pass High School.
Ownership History
Date
Name
Owned For
Owner Type
Purchase Details
Closed on
Sep 30, 2021
Sold by
Jth Llc
Bought by
Imperium Llc
Current Estimated Value
Home Financials for this Owner
Home Financials are based on the most recent Mortgage that was taken out on this home.
Original Mortgage
$835,000
Outstanding Balance
$759,788
Interest Rate
2.8%
Mortgage Type
Credit Line Revolving
Estimated Equity
$413,254
Purchase Details
Closed on
Sep 28, 2021
Sold by
Jth Lic
Bought by
Imperium Llc
Home Financials for this Owner
Home Financials are based on the most recent Mortgage that was taken out on this home.
Original Mortgage
$835,000
Outstanding Balance
$759,788
Interest Rate
2.8%
Mortgage Type
Credit Line Revolving
Estimated Equity
$413,254
Purchase Details
Closed on
Jan 27, 2017
Sold by
Ts&D Development Llc
Bought by
Jth Llc
Purchase Details
Closed on
Apr 20, 2007
Sold by
Jacoby Properties Llc
Bought by
Ts&D Development Llc
Home Financials for this Owner
Home Financials are based on the most recent Mortgage that was taken out on this home.
Original Mortgage
$280,000
Interest Rate
6.1%
Mortgage Type
Commercial
Purchase Details
Closed on
Aug 3, 2005
Sold by
Jacoby Development Llc
Bought by
Jacoby Homes Inc
Create a Home Valuation Report for This Property
The Home Valuation Report is an in-depth analysis detailing your home's value as well as a comparison with similar homes in the area
Home Values in the Area
Average Home Value in this Area
Purchase History
| Date | Buyer | Sale Price | Title Company |
|---|---|---|---|
| Imperium Llc | $1,115,000 | First American | |
| Imperium Llc | $1,115,000 | First American Title | |
| Jth Llc | $815,000 | First American | |
| Ts&D Development Llc | $1,200,000 | Ticor Title | |
| Jacoby Homes Inc | $629,300 | Ticor Title |
Source: Public Records
Mortgage History
| Date | Status | Borrower | Loan Amount |
|---|---|---|---|
| Open | Imperium Llc | $835,000 | |
| Closed | Imperium Llc | $835,000 | |
| Previous Owner | Ts&D Development Llc | $280,000 |
Source: Public Records
Tax History Compared to Growth
Tax History
| Year | Tax Paid | Tax Assessment Tax Assessment Total Assessment is a certain percentage of the fair market value that is determined by local assessors to be the total taxable value of land and additions on the property. | Land | Improvement |
|---|---|---|---|---|
| 2025 | $9,097 | $700,510 | -- | -- |
| 2024 | $9,097 | $680,110 | -- | -- |
| 2023 | $8,568 | $660,310 | $0 | $0 |
| 2022 | $8,350 | $641,080 | $0 | $0 |
| 2021 | $8,085 | $622,410 | $0 | $0 |
| 2020 | $7,852 | $604,290 | $0 | $0 |
| 2019 | $7,625 | $586,690 | $0 | $0 |
| 2018 | $7,759 | $569,610 | $0 | $0 |
| 2017 | $7,701 | $553,020 | $0 | $0 |
| 2016 | $6,770 | $536,920 | $0 | $0 |
| 2015 | $6,549 | $521,290 | $0 | $0 |
| 2014 | $6,369 | $506,110 | $0 | $0 |
Source: Public Records
Map
Nearby Homes