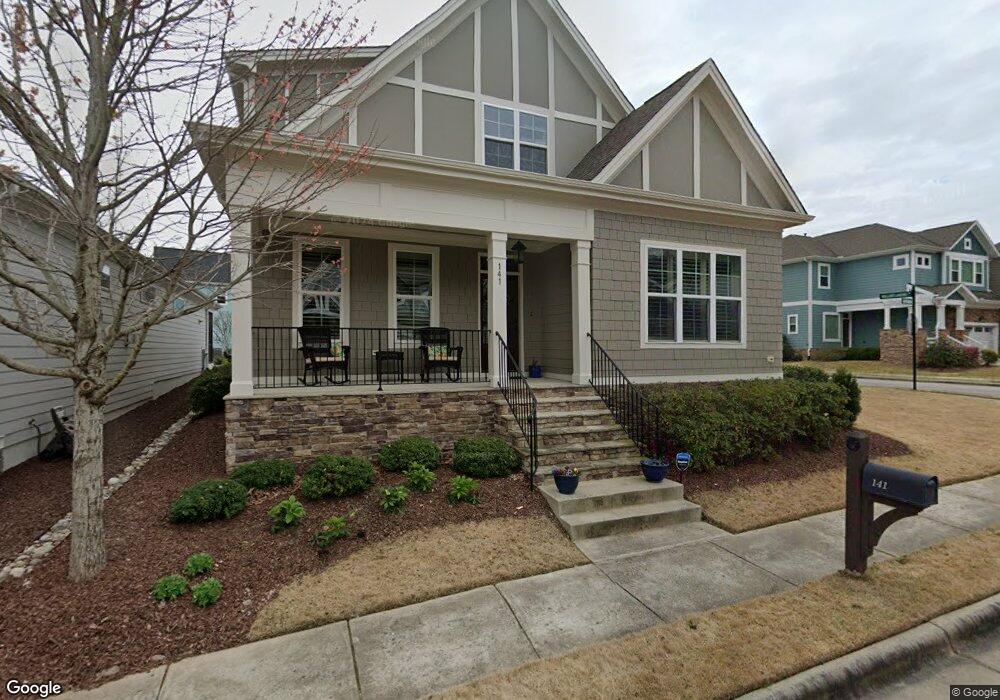
141 Old Piedmont Cir Unit 923 Chapel Hill, NC 27516
Estimated Value: $638,536 - $696,000
3
Beds
3
Baths
2,195
Sq Ft
$301/Sq Ft
Est. Value
About This Home
This home is located at 141 Old Piedmont Cir Unit 923, Chapel Hill, NC 27516 and is currently estimated at $659,634, approximately $300 per square foot. 141 Old Piedmont Cir Unit 923 is a home located in Orange County with nearby schools including Margaret B. Pollard Middle School and Woods Charter.
Ownership History
Date
Name
Owned For
Owner Type
Purchase Details
Closed on
Mar 12, 2021
Sold by
Harkey P Donald P and Harkey Aina K
Bought by
Mikan Teresa
Current Estimated Value
Home Financials for this Owner
Home Financials are based on the most recent Mortgage that was taken out on this home.
Original Mortgage
$346,000
Outstanding Balance
$310,164
Interest Rate
2.7%
Mortgage Type
New Conventional
Estimated Equity
$349,470
Purchase Details
Closed on
Aug 14, 2015
Sold by
Homes By Dickerson Inc
Bought by
Harkey P Donald and Harkey Aina K
Home Financials for this Owner
Home Financials are based on the most recent Mortgage that was taken out on this home.
Original Mortgage
$348,093
Interest Rate
3.12%
Mortgage Type
Adjustable Rate Mortgage/ARM
Purchase Details
Closed on
May 14, 2015
Sold by
Nnp Briar Chapel Llc
Bought by
Homes By Dickerson Inc
Create a Home Valuation Report for This Property
The Home Valuation Report is an in-depth analysis detailing your home's value as well as a comparison with similar homes in the area
Home Values in the Area
Average Home Value in this Area
Purchase History
| Date | Buyer | Sale Price | Title Company |
|---|---|---|---|
| Mikan Teresa | $434,000 | None Available | |
| Harkey P Donald | $390,500 | Attorney | |
| Homes By Dickerson Inc | $64,000 | Attorney |
Source: Public Records
Mortgage History
| Date | Status | Borrower | Loan Amount |
|---|---|---|---|
| Open | Mikan Teresa | $346,000 | |
| Previous Owner | Harkey P Donald | $348,093 |
Source: Public Records
Tax History Compared to Growth
Tax History
| Year | Tax Paid | Tax Assessment Tax Assessment Total Assessment is a certain percentage of the fair market value that is determined by local assessors to be the total taxable value of land and additions on the property. | Land | Improvement |
|---|---|---|---|---|
| 2024 | $4,241 | $383,324 | $93,680 | $289,644 |
| 2023 | $3,407 | $383,324 | $93,680 | $289,644 |
| 2022 | $3,126 | $383,324 | $93,680 | $289,644 |
| 2021 | $3,088 | $383,324 | $93,680 | $289,644 |
| 2020 | $3,071 | $378,715 | $60,000 | $318,715 |
| 2019 | $3,071 | $378,715 | $60,000 | $318,715 |
| 2018 | $2,860 | $378,715 | $60,000 | $318,715 |
| 2017 | $2,848 | $378,715 | $60,000 | $318,715 |
| 2016 | $2,460 | $316,877 | $60,000 | $256,877 |
| 2015 | $391 | $54,000 | $54,000 | $0 |
Source: Public Records
Map
Nearby Homes
- 40 Mallard Landing Dr
- 165 Old Piedmont Cir
- 1980 Great Ridge Pkwy
- 49 Salt Cedar Ln
- 72 Monarch Trail
- 12 Beacon Ridge Blvd
- 42 Juneberry Dr
- 262 Salt Cedar Ln
- 418 Quarter Gate Trace
- 25 Hawk Point Rd
- 194 Quarter Gate Trace
- 440 Quarter Gate Trace
- 77 Hawk Point Rd
- 438 Granite Mill Blvd
- 442 Granite Mill Blvd
- 136 Serenity Hill Cir
- 79 Heatherwood Dr
- 92 Heatherwood Dr
- 47 Balfour Run
- 132 Deardom Way
- 141 Old Piedmont Cir
- 133 Old Piedmont Cir Unit Lt922
- 133 Old Piedmont Cir
- 125 Old Piedmont Cir Unit Lt921
- 142 Old Piedmont Cir Unit Lt903
- 117 Old Piedmont Cir Unit Lt920
- 41 Mallard Landing Dr
- 132 Old Piedmont Cir Unit Lt902
- 156 Old Piedmont Cir Unit Lt904
- 34 Mallard Landing Dr
- 120 Old Piedmont Cir Unit Lt901
- 164 Old Piedmont Cir Unit Lt905
- 49 Mallard Landing Dr
- 109 Old Piedmont Cir Unit Lt919
- 109 Old Piedmont Cir
- 179 Old Piedmont Cir
- 176 Old Piedmont Cir Unit Lt906
- 176 Old Piedmont Cir
- 55 Mallard Landing Dr
- 110 Old Piedmont Cir Unit Lt900