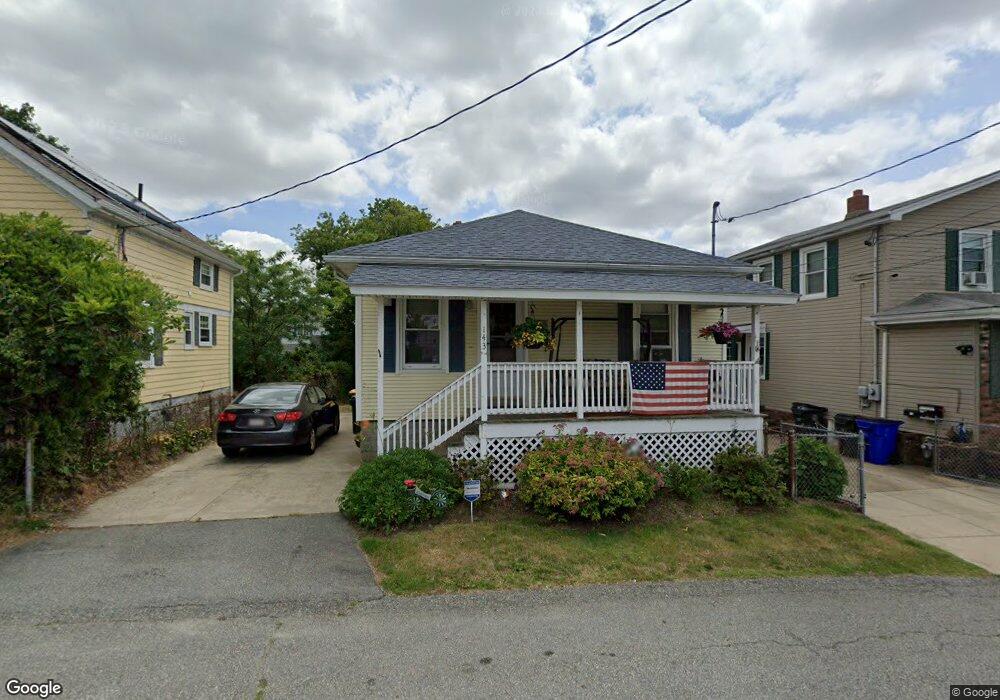
141 Pebble St Fall River, MA 02721
Maplewood NeighborhoodEstimated Value: $293,000 - $388,000
2
Beds
1
Bath
864
Sq Ft
$394/Sq Ft
Est. Value
About This Home
This home is located at 141 Pebble St, Fall River, MA 02721 and is currently estimated at $340,545, approximately $394 per square foot. 141 Pebble St is a home located in Bristol County with nearby schools including Letourneau Elementary School, Matthew J. Kuss Middle School, and B M C Durfee High School.
Ownership History
Date
Name
Owned For
Owner Type
Purchase Details
Closed on
Jun 4, 2001
Sold by
Est Dougherty Julia M and Dobbins Suzanne
Bought by
Wrenn Leonard H and Wrenn Anette M
Current Estimated Value
Home Financials for this Owner
Home Financials are based on the most recent Mortgage that was taken out on this home.
Original Mortgage
$134,450
Outstanding Balance
$48,602
Interest Rate
7.09%
Mortgage Type
Purchase Money Mortgage
Estimated Equity
$291,943
Create a Home Valuation Report for This Property
The Home Valuation Report is an in-depth analysis detailing your home's value as well as a comparison with similar homes in the area
Home Values in the Area
Average Home Value in this Area
Purchase History
| Date | Buyer | Sale Price | Title Company |
|---|---|---|---|
| Wrenn Leonard H | $37,500 | -- | |
| Wrenn Leonard H | $37,500 | -- |
Source: Public Records
Mortgage History
| Date | Status | Borrower | Loan Amount |
|---|---|---|---|
| Open | Wrenn Leonard H | $134,450 |
Source: Public Records
Tax History
| Year | Tax Paid | Tax Assessment Tax Assessment Total Assessment is a certain percentage of the fair market value that is determined by local assessors to be the total taxable value of land and additions on the property. | Land | Improvement |
|---|---|---|---|---|
| 2025 | $3,470 | $303,100 | $124,400 | $178,700 |
| 2024 | $3,238 | $281,800 | $119,700 | $162,100 |
| 2023 | $3,050 | $248,600 | $102,600 | $146,000 |
| 2022 | $2,739 | $217,000 | $93,300 | $123,700 |
| 2021 | $3,908 | $180,900 | $86,300 | $94,600 |
| 2020 | $3,794 | $140,600 | $82,600 | $58,000 |
| 2019 | $1,993 | $136,700 | $78,700 | $58,000 |
| 2018 | $1,886 | $129,000 | $77,200 | $51,800 |
| 2017 | $3,703 | $167,900 | $78,800 | $89,100 |
| 2016 | $2,423 | $177,800 | $82,100 | $95,700 |
| 2015 | $1,993 | $152,400 | $79,000 | $73,400 |
| 2014 | $1,970 | $156,600 | $83,200 | $73,400 |
Source: Public Records
Map
Nearby Homes
Your Personal Tour Guide
Ask me questions while you tour the home.