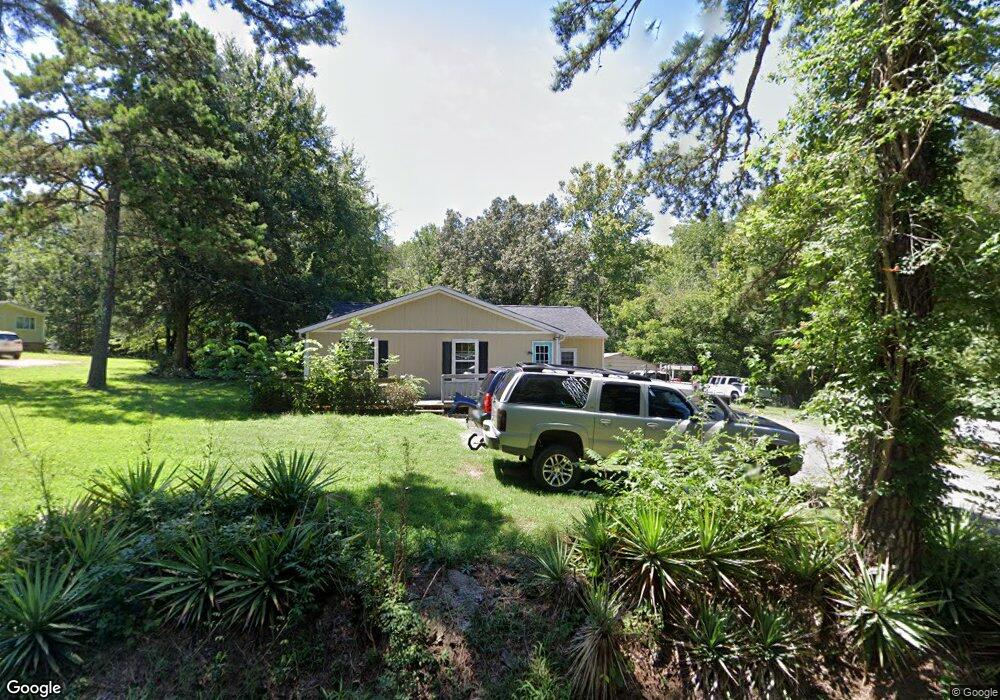
141 Pine Grove Church Rd Concord, NC 28025
Estimated Value: $266,000 - $395,000
3
Beds
1
Bath
1,558
Sq Ft
$203/Sq Ft
Est. Value
About This Home
This home is located at 141 Pine Grove Church Rd, Concord, NC 28025 and is currently estimated at $316,370, approximately $203 per square foot. 141 Pine Grove Church Rd is a home located in Cabarrus County with nearby schools including Patriots Elementary School, C.C. Griffin Middle School, and Hickory Ridge High School.
Ownership History
Date
Name
Owned For
Owner Type
Purchase Details
Closed on
Apr 22, 2009
Sold by
Penvose Sherry Lynn
Bought by
Craig Arvel Lee
Current Estimated Value
Home Financials for this Owner
Home Financials are based on the most recent Mortgage that was taken out on this home.
Original Mortgage
$83,460
Outstanding Balance
$52,618
Interest Rate
4.89%
Mortgage Type
FHA
Estimated Equity
$263,752
Purchase Details
Closed on
Sep 28, 2006
Sold by
Penvose Patricia
Bought by
Penvose Sherry Lynn
Home Financials for this Owner
Home Financials are based on the most recent Mortgage that was taken out on this home.
Original Mortgage
$126,000
Interest Rate
6.48%
Mortgage Type
New Conventional
Purchase Details
Closed on
Oct 1, 2005
Sold by
Penvose Sherry L
Bought by
Penvose Patricia and Trust Agreement Of Sherry Lynn Penvose
Purchase Details
Closed on
Sep 1, 1988
Create a Home Valuation Report for This Property
The Home Valuation Report is an in-depth analysis detailing your home's value as well as a comparison with similar homes in the area
Home Values in the Area
Average Home Value in this Area
Purchase History
| Date | Buyer | Sale Price | Title Company |
|---|---|---|---|
| Craig Arvel Lee | $85,000 | Investors Title Insurance Co | |
| Penvose Sherry Lynn | -- | None Available | |
| Penvose Patricia | -- | Chicago Title Insurance Comp | |
| -- | $20,000 | -- |
Source: Public Records
Mortgage History
| Date | Status | Borrower | Loan Amount |
|---|---|---|---|
| Open | Craig Arvel Lee | $83,460 | |
| Previous Owner | Penvose Sherry Lynn | $126,000 |
Source: Public Records
Tax History Compared to Growth
Tax History
| Year | Tax Paid | Tax Assessment Tax Assessment Total Assessment is a certain percentage of the fair market value that is determined by local assessors to be the total taxable value of land and additions on the property. | Land | Improvement |
|---|---|---|---|---|
| 2025 | -- | $234,120 | $48,810 | $185,310 |
| 2024 | $1,583 | $234,120 | $48,810 | $185,310 |
| 2023 | $1,154 | $137,420 | $28,840 | $108,580 |
| 2022 | $1,088 | $129,550 | $28,840 | $100,710 |
| 2021 | $1,049 | $129,550 | $28,840 | $100,710 |
| 2020 | $1,049 | $129,550 | $28,840 | $100,710 |
| 2019 | $826 | $101,980 | $22,190 | $79,790 |
| 2018 | $767 | $98,310 | $22,190 | $76,120 |
| 2017 | $747 | $98,310 | $22,190 | $76,120 |
| 2016 | $737 | $102,290 | $28,840 | $73,450 |
| 2015 | $763 | $102,290 | $28,840 | $73,450 |
| 2014 | $763 | $102,290 | $28,840 | $73,450 |
Source: Public Records
Map
Nearby Homes
- 8975 Lazy Ridge Ln
- 460 Pine Grove Church Rd
- 8186 Christopher Ln
- 803 Freeman Rd
- 7434 Dover Mill Dr SW
- 999 Stones Throw Dr
- 1829 Mill Creek Ln SW
- 7339 Dover Mill Dr SW
- 7319 Childress Dr South W
- 7332 Childress Dr South W
- 7319 Childress Dr SW
- 7443 Childress Dr
- 1725 Mill Creek Ln SW
- 7397 Mill Ruins Ave SW
- 7412 Greene Mill Ave SW
- 1556 Scarbrough Cir SW
- 1516 Bailiff Ct SW
- 1707 Scarbrough Cir SW
- 7411 Greene Mill Ave SW
- Mendelssohn Basement Plan at The Mills at Rocky River - Townhomes
- 144 Pine Grove Church Rd
- 147 Pine Grove Church Rd
- 129 Pine Grove Church Rd
- 159 Pine Grove Church Rd
- 166 Pine Grove Church Rd
- 119 Pine Grove Church Rd
- 120 Pine Grove Church Rd
- 167 Pine Grove Church Rd
- 110 Pine Grove Church Rd
- 130 Pine Grove Church Rd
- 183 Pine Grove Church Rd
- 121 Pine Grove Church Rd
- 251 Pine Grove Church Rd
- 251 Pine Grove Church Rd
- 261 Pine Grove Church Rd
- 8835 Lazy Ridge Ln
- 8735 Lazy Ridge Ln
- 109 Pine Grove Church Rd
- 74 Pine Grove Church Rd
- 74 Pine Grove Church Rd