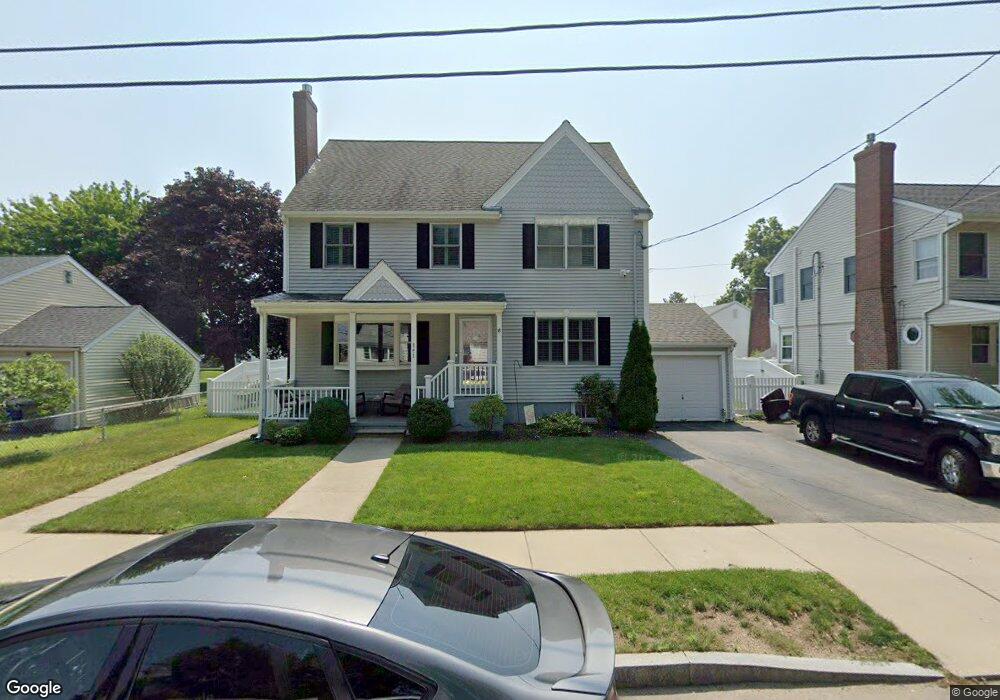
141 Rice Rd Quincy, MA 02170
Wollaston NeighborhoodEstimated Value: $848,000 - $877,000
4
Beds
2
Baths
2,102
Sq Ft
$409/Sq Ft
Est. Value
About This Home
This home is located at 141 Rice Rd, Quincy, MA 02170 and is currently estimated at $860,097, approximately $409 per square foot. 141 Rice Rd is a home located in Norfolk County with nearby schools including Beechwood Knoll Elementary School, Central Middle School, and North Quincy High School.
Ownership History
Date
Name
Owned For
Owner Type
Purchase Details
Closed on
Dec 31, 2020
Sold by
Cayer Allison K and Cayer Shawn B
Bought by
Cayer Shawn B and Cayer Allison K
Current Estimated Value
Home Financials for this Owner
Home Financials are based on the most recent Mortgage that was taken out on this home.
Original Mortgage
$460,000
Outstanding Balance
$406,523
Interest Rate
2.8%
Mortgage Type
New Conventional
Estimated Equity
$453,574
Purchase Details
Closed on
Dec 9, 2020
Sold by
Spring Edward J and Spring Ruth E
Bought by
Cayer Allison K
Home Financials for this Owner
Home Financials are based on the most recent Mortgage that was taken out on this home.
Original Mortgage
$460,000
Outstanding Balance
$406,523
Interest Rate
2.8%
Mortgage Type
New Conventional
Estimated Equity
$453,574
Purchase Details
Closed on
Dec 28, 2010
Sold by
Kelson Robert M and Kelson Allison S
Bought by
Kelson Allison S and Spring Edward J
Home Financials for this Owner
Home Financials are based on the most recent Mortgage that was taken out on this home.
Original Mortgage
$329,000
Interest Rate
4.17%
Mortgage Type
Purchase Money Mortgage
Purchase Details
Closed on
Apr 14, 1999
Sold by
Spring Kathrine J
Bought by
Spring Allison
Create a Home Valuation Report for This Property
The Home Valuation Report is an in-depth analysis detailing your home's value as well as a comparison with similar homes in the area
Home Values in the Area
Average Home Value in this Area
Purchase History
| Date | Buyer | Sale Price | Title Company |
|---|---|---|---|
| Cayer Shawn B | -- | None Available | |
| Cayer Allison K | -- | None Available | |
| Kelson Allison S | -- | -- | |
| Kelson Allison S | -- | -- | |
| Spring Allison | $140,000 | -- |
Source: Public Records
Mortgage History
| Date | Status | Borrower | Loan Amount |
|---|---|---|---|
| Open | Cayer Allison K | $460,000 | |
| Previous Owner | Kelson Allison S | $329,000 | |
| Previous Owner | Spring Allison | $335,000 | |
| Previous Owner | Spring Allison | $250,400 |
Source: Public Records
Tax History
| Year | Tax Paid | Tax Assessment Tax Assessment Total Assessment is a certain percentage of the fair market value that is determined by local assessors to be the total taxable value of land and additions on the property. | Land | Improvement |
|---|---|---|---|---|
| 2025 | $9,245 | $801,800 | $355,200 | $446,600 |
| 2024 | $8,872 | $787,200 | $355,200 | $432,000 |
| 2023 | $8,245 | $740,800 | $338,300 | $402,500 |
| 2022 | $7,845 | $654,800 | $270,600 | $384,200 |
| 2021 | $7,781 | $640,900 | $270,600 | $370,300 |
| 2020 | $7,674 | $617,400 | $270,600 | $346,800 |
| 2019 | $7,323 | $583,500 | $252,900 | $330,600 |
| 2018 | $7,304 | $547,500 | $229,900 | $317,600 |
| 2017 | $6,986 | $493,000 | $229,900 | $263,100 |
| 2016 | $6,471 | $450,600 | $209,000 | $241,600 |
| 2015 | $6,009 | $411,600 | $190,000 | $221,600 |
| 2014 | $6,036 | $406,200 | $181,000 | $225,200 |
Source: Public Records
Map
Nearby Homes
- 55 Copley St
- 144 Kemper St
- 28 Apthorp St
- 20 Ellington Rd
- 22 Newton Ave
- 10 Weston Ave Unit 322
- 297 Billings St
- 105 Sea St Unit 105
- 105 Sea St Unit 102
- 85 E Squantum St Unit 10
- 11 Plover Rd
- 201 Billings St
- 1025 Hancock St Unit 6J
- 1025 Hancock St Unit 2K
- 72 Oakland Ave
- 25 Moffat Rd
- 17 Holmes St Unit 204
- 17 Holmes St Unit 2
- 17 Holmes St Unit 1
- 98 Safford St
- 145 Rice Rd
- 135 Rice Rd
- 12 Princess Eve Dr
- 12 Princess Eve Dr Unit 12
- 20 Princess Eve Dr
- 26 Princess Eve Dr
- 142 Rice Rd
- 151 Rice Rd
- 43 Labadine St
- 134 Rice Rd
- 32 Princess Eve Dr
- 154 Rice Rd
- 130 Rice Rd
- 157 Rice Rd
- 123 Rice Rd
- 9 Princess Eve Dr
- 36 Princess Eve Dr
- 17 Princess Eve Dr
- 31 Chick St
- 21 Princess Eve Dr
Your Personal Tour Guide
Ask me questions while you tour the home.