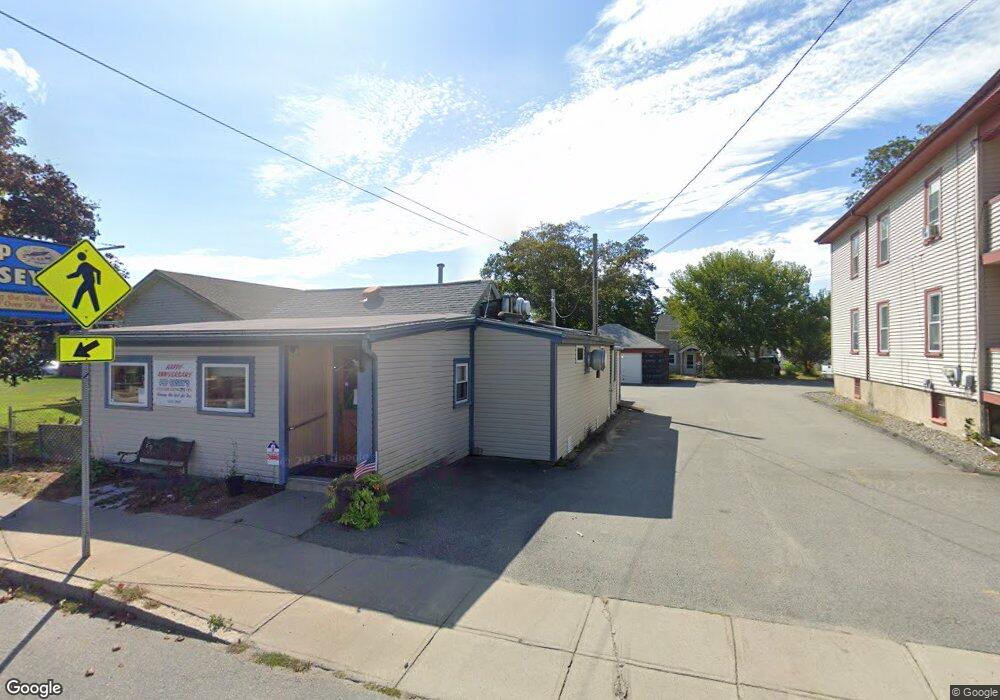
141 S Main St Acushnet, MA 02743
Estimated Value: $349,000 - $531,000
6
Beds
2
Baths
2,640
Sq Ft
$166/Sq Ft
Est. Value
About This Home
This home is located at 141 S Main St, Acushnet, MA 02743 and is currently estimated at $438,154, approximately $165 per square foot. 141 S Main St is a home located in Bristol County with nearby schools including Acushnet Elementary School, Albert F Ford Middle School, and Alma Del Mar Charter School.
Ownership History
Date
Name
Owned For
Owner Type
Purchase Details
Closed on
Mar 15, 2021
Sold by
Lynn I Baker Ret and Bryant
Bought by
Elderkin Katie E
Current Estimated Value
Purchase Details
Closed on
Oct 11, 2019
Sold by
Baker Lynn I and Baker Douglas C
Bought by
Lynn I Baker Ret 2019 and Baker
Purchase Details
Closed on
Oct 9, 2019
Sold by
Baker Lynn I
Bought by
Baker Lynn I and Baker Douglas C
Purchase Details
Closed on
Apr 6, 2007
Sold by
Castonguay Roland
Bought by
Baker Lynn I
Create a Home Valuation Report for This Property
The Home Valuation Report is an in-depth analysis detailing your home's value as well as a comparison with similar homes in the area
Home Values in the Area
Average Home Value in this Area
Purchase History
| Date | Buyer | Sale Price | Title Company |
|---|---|---|---|
| Elderkin Katie E | $20,000 | None Available | |
| Lynn I Baker Ret 2019 | -- | -- | |
| Baker Lynn I | -- | -- | |
| Baker Lynn I | -- | -- | |
| Castonguay Roland | -- | -- |
Source: Public Records
Tax History
| Year | Tax Paid | Tax Assessment Tax Assessment Total Assessment is a certain percentage of the fair market value that is determined by local assessors to be the total taxable value of land and additions on the property. | Land | Improvement |
|---|---|---|---|---|
| 2025 | $48 | $443,300 | $177,500 | $265,800 |
| 2024 | $4,582 | $401,600 | $163,800 | $237,800 |
| 2023 | $4,026 | $237,100 | $150,200 | $86,900 |
| 2022 | $3,742 | $217,800 | $136,500 | $81,300 |
| 2021 | $3,665 | $217,800 | $136,500 | $81,300 |
| 2020 | $3,910 | $217,800 | $136,500 | $81,300 |
| 2019 | $3,616 | $198,700 | $117,400 | $81,300 |
| 2018 | $2,749 | $194,600 | $113,300 | $81,300 |
| 2017 | $3,571 | $194,600 | $113,300 | $81,300 |
| 2016 | $3,603 | $193,700 | $113,300 | $80,400 |
| 2015 | $3,541 | $193,700 | $113,300 | $80,400 |
Source: Public Records
Map
Nearby Homes
- 14 Hayes St Unit 1
- 12 Hayes St Unit 1
- 91 S Main St
- 11 Boylston St
- 122 Truro St
- 12 White St
- 53 Howard Ave
- 81 Sylvia St
- 0 Hathaway Rd Unit 73469544
- 112 Lawson Ave
- 759 Belleville Ave
- 20 Jake Ln
- 4 Sam St
- 5 William St
- 99 Hatch St
- 1940-1942 Acushnet Ave
- 23 Oliveira Ave
- 34 Chicopee St
- 14 Caswell St
- 41 Chershire Ave
Your Personal Tour Guide
Ask me questions while you tour the home.