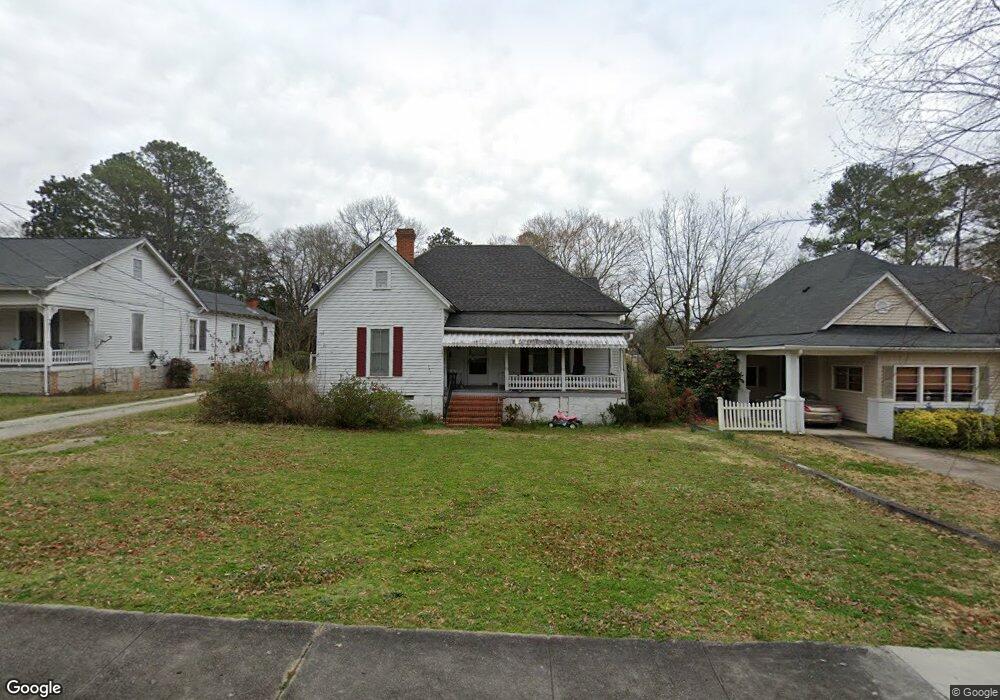
141 S Tusten St Elberton, GA 30635
Estimated Value: $177,520 - $188,000
3
Beds
1
Bath
1,554
Sq Ft
$118/Sq Ft
Est. Value
About This Home
This home is located at 141 S Tusten St, Elberton, GA 30635 and is currently estimated at $183,380, approximately $118 per square foot. 141 S Tusten St is a home located in Elbert County with nearby schools including Elbert County Primary School, Elbert County Elementary School, and Elbert County Middle School.
Ownership History
Date
Name
Owned For
Owner Type
Purchase Details
Closed on
Nov 3, 2017
Sold by
Lloyd Gladys Ann Williams
Bought by
Torres Silvestre and Valencia Maria Lorena Vargas
Current Estimated Value
Purchase Details
Closed on
May 13, 2015
Sold by
Lloyd Ann W
Bought by
Hodges Thomas L and Hodges Carolyn B
Purchase Details
Closed on
Jan 6, 2000
Sold by
Lloyd Larry Kimball Trustee Gl
Bought by
Lloyd Gladys Ann Williams
Purchase Details
Closed on
Dec 28, 1999
Sold by
Lloyd Larry Kerry Anna Berryman Jenny
Bought by
Lloyd Larry Kimball Trustee Gladys Ann W
Purchase Details
Closed on
Jan 21, 1999
Sold by
Lloyd William Vernon Estate
Bought by
Lloyd Larry Kerry Anna Berryman
Purchase Details
Closed on
Sep 1, 1990
Sold by
Thornton Joseph Ambrus and Thornton Virginia G
Bought by
Lloyd William V and Lloyd Ann W
Purchase Details
Closed on
Nov 1, 1986
Create a Home Valuation Report for This Property
The Home Valuation Report is an in-depth analysis detailing your home's value as well as a comparison with similar homes in the area
Home Values in the Area
Average Home Value in this Area
Purchase History
| Date | Buyer | Sale Price | Title Company |
|---|---|---|---|
| Torres Silvestre | -- | -- | |
| Hodges Thomas L | $1,200 | -- | |
| Lloyd Gladys Ann Williams | -- | -- | |
| Lloyd Larry Kimball Trustee Gladys Ann W | -- | -- | |
| Lloyd Larry Kerry Anna Berryman | -- | -- | |
| Lloyd William V | $34,000 | -- | |
| -- | $20,000 | -- |
Source: Public Records
Tax History Compared to Growth
Tax History
| Year | Tax Paid | Tax Assessment Tax Assessment Total Assessment is a certain percentage of the fair market value that is determined by local assessors to be the total taxable value of land and additions on the property. | Land | Improvement |
|---|---|---|---|---|
| 2024 | $1,434 | $58,292 | $7,081 | $51,211 |
| 2023 | $1,434 | $58,292 | $7,081 | $51,211 |
| 2022 | $1,101 | $44,765 | $7,081 | $37,684 |
| 2021 | $1,110 | $44,765 | $7,081 | $37,684 |
| 2020 | $1,014 | $36,783 | $7,081 | $29,702 |
| 2019 | $1,047 | $36,783 | $7,081 | $29,702 |
| 2018 | $1,070 | $36,783 | $7,081 | $29,702 |
| 2017 | $997 | $31,721 | $7,081 | $24,640 |
| 2016 | $931 | $31,721 | $7,081 | $24,640 |
| 2015 | -- | $31,761 | $7,121 | $24,640 |
| 2014 | -- | $31,761 | $7,121 | $24,640 |
| 2013 | -- | $29,474 | $7,121 | $22,354 |
Source: Public Records
Map
Nearby Homes
- 120 S Tusten St
- 245 Edwards St
- 252 Edwards St
- 105 S Thomas St
- 135 Brookside Dr
- 173 Brookside Dr
- 214 Campbell St
- 181 Brookside Dr
- 968 Ext Elbert St
- 2790 Cedar Creek Rd
- 196 S Oliver St
- 62 Oak St
- 141 Wildwood Dr
- 0 Oak Dr Unit 7643600
- 0 Oak Dr Unit 10598083
- 118 Oak Dr
- 108 Brookhaven Cir
- 89 College Ave
- 415 Athenia St
- 136 Forest Ave
- 145 S Tusten St
- 137 S Tusten St
- 151 S Tusten St
- 131 S Tusten St
- 155 S Tusten St
- 401 Edwards St
- 138 S Tusten St
- 144 S Tusten St
- 148 S Tusten St
- 128 S Tusten St
- 121 S Tusten St
- 132 S Tusten St
- 416 Grogan Cir
- 270 Edwards St
- 167 S Tusten St
- 253 Edwards St
- 320 Edwards St
- 115 S Tusten St
- 405 Edwards St
- 266 Edwards St