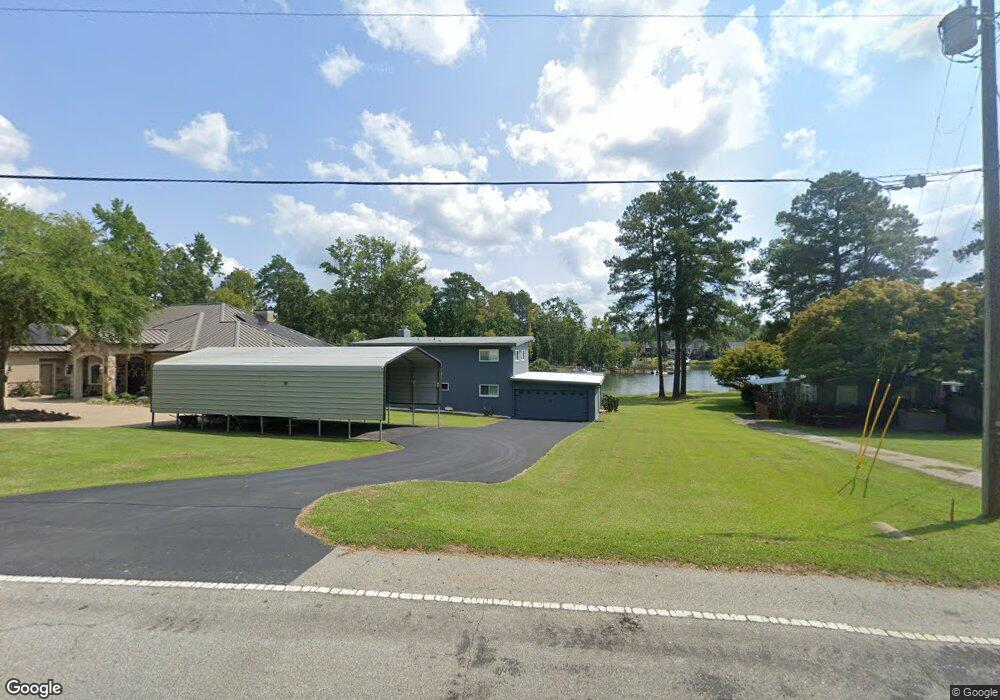
141 Sylvan St Chapin, SC 29036
Estimated Value: $596,000 - $959,000
2
Beds
2
Baths
2,730
Sq Ft
$279/Sq Ft
Est. Value
About This Home
This home is located at 141 Sylvan St, Chapin, SC 29036 and is currently estimated at $761,267, approximately $278 per square foot. 141 Sylvan St is a home with nearby schools including Chapin Elementary School, Chapin Intermediate, and Chapin High School.
Ownership History
Date
Name
Owned For
Owner Type
Purchase Details
Closed on
Jan 8, 2022
Sold by
Billy Rich
Bought by
Lonnie Gene Hensley Trust and Mary W Hensley Living Trust
Current Estimated Value
Purchase Details
Closed on
Oct 27, 2021
Sold by
Rich Billy and Rich Marie B
Bought by
Hensley Lonnie Gene and Lonnie Gene Hensley Trust
Purchase Details
Closed on
Mar 26, 2010
Sold by
Rich Marie B and Dixon Marie Booth
Bought by
Rich Marie B and Rich Billy
Home Financials for this Owner
Home Financials are based on the most recent Mortgage that was taken out on this home.
Original Mortgage
$130,000
Interest Rate
5.02%
Mortgage Type
Future Advance Clause Open End Mortgage
Purchase Details
Closed on
Jun 27, 2002
Sold by
Smith Barbara W
Bought by
Colony Home Bldrs Inc
Create a Home Valuation Report for This Property
The Home Valuation Report is an in-depth analysis detailing your home's value as well as a comparison with similar homes in the area
Home Values in the Area
Average Home Value in this Area
Purchase History
| Date | Buyer | Sale Price | Title Company |
|---|---|---|---|
| Lonnie Gene Hensley Trust | -- | None Listed On Document | |
| Hensley Lonnie Gene | $600,000 | None Available | |
| Rich Marie B | -- | -- | |
| Colony Home Bldrs Inc | $4,138 | -- |
Source: Public Records
Mortgage History
| Date | Status | Borrower | Loan Amount |
|---|---|---|---|
| Previous Owner | Rich Marie B | $130,000 |
Source: Public Records
Tax History
| Year | Tax Paid | Tax Assessment Tax Assessment Total Assessment is a certain percentage of the fair market value that is determined by local assessors to be the total taxable value of land and additions on the property. | Land | Improvement |
|---|---|---|---|---|
| 2024 | $3,438 | $24,000 | $8,800 | $15,200 |
| 2023 | $3,672 | $24,000 | $8,800 | $15,200 |
| 2022 | $3,705 | $24,000 | $8,800 | $15,200 |
| 2020 | $1,526 | $11,878 | $6,881 | $4,997 |
| 2019 | $1,299 | $10,329 | $6,400 | $3,929 |
| 2018 | $1,137 | $10,329 | $6,400 | $3,929 |
| 2017 | $1,104 | $10,329 | $6,400 | $3,929 |
| 2016 | $1,140 | $10,329 | $6,400 | $3,929 |
| 2014 | $1,328 | $9,217 | $4,548 | $4,669 |
| 2013 | -- | $9,220 | $4,550 | $4,670 |
Source: Public Records
Map
Nearby Homes
- 192 Palm St
- 180 Palm St
- 409 Dutchman Shores Cir
- 134 Walkbridge Way
- 188 Kerry Gibbons Dr
- 512 Stucks Point Dr
- 229 Dutchman Shores Cir
- 0 Dreher Island Rd Unit 21647709
- 0 Dreher Island Rd Unit 587193
- 368 Frick Ct
- 392 Eagle Pointe Dr
- 147 Ventnor Ave
- 151 Ventnor Ave
- 852 Misty Harbor Rd
- 528 Bear Creek Rd
- 814 Dutchmaster Dr
- 820 Dutchmaster Dr
- 160 State Road S-32-716
- 108 Pennsylvania Ct
- 540 Lakeshore Dr
- 137 Sylvan St
- 147 Sylvan St
- 133 Sylvan St
- 149 Sylvan St
- 0 Sylvan St Unit 241595
- 0 Sylvan St Unit 241597
- 0 Sylvan St Unit 245327
- 0 Sylvan St Unit 245322
- 0 Sylvan St Unit 259892
- 0 Sylvan St Unit 245331
- 0 Sylvan St Unit 245306
- 0 Sylvan St Unit 245325
- 0 Sylvan St Unit 261837
- 0 Sylvan St Unit 263413
- 0 Sylvan St Unit 267133
- 0 Sylvan St Unit 267132
- 0 Sylvan St Unit 289347
- 0 Sylvan St Unit 293174
- 0 Sylvan St Unit 293172
- 2 Sylvan St
Your Personal Tour Guide
Ask me questions while you tour the home.