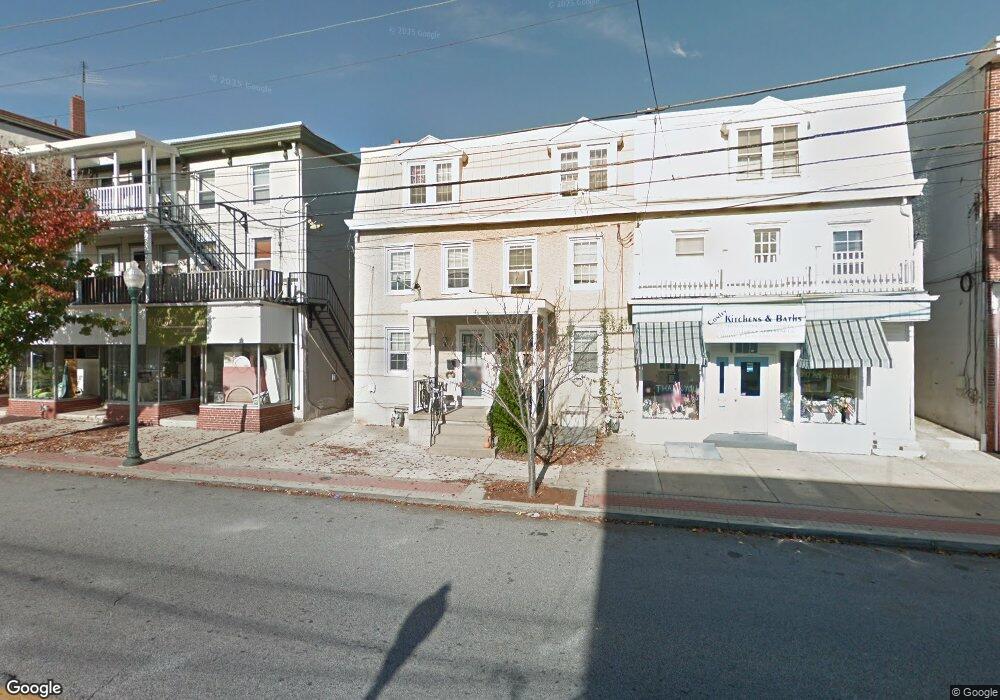
141 W Lancaster Ave Downingtown, PA 19335
Estimated Value: $262,000 - $344,000
3
Beds
1
Bath
1,344
Sq Ft
$235/Sq Ft
Est. Value
About This Home
This home is located at 141 W Lancaster Ave, Downingtown, PA 19335 and is currently estimated at $315,321, approximately $234 per square foot. 141 W Lancaster Ave is a home located in Chester County with nearby schools including Beaver Creek Elementary School, Downingtown Middle School, and Downingtown High School West.
Ownership History
Date
Name
Owned For
Owner Type
Purchase Details
Closed on
Aug 11, 2015
Sold by
Barbara Fullman
Bought by
My Livable Homes Llc
Current Estimated Value
Purchase Details
Closed on
Aug 28, 2014
Sold by
Marjam Properties Llc
Bought by
Fullman Barbara
Purchase Details
Closed on
Nov 26, 2008
Sold by
Carroll Joseph and Carroll Barbara
Bought by
Marjam Properties Llc
Home Financials for this Owner
Home Financials are based on the most recent Mortgage that was taken out on this home.
Original Mortgage
$250,400
Interest Rate
6.49%
Mortgage Type
Future Advance Clause Open End Mortgage
Purchase Details
Closed on
Oct 23, 2003
Sold by
Demucci Louise B
Bought by
Demucci Louise B and Demucci Joseph A
Purchase Details
Closed on
Nov 24, 1998
Sold by
Eachus Helen L and Francella Rena
Bought by
Demucci Louise B
Create a Home Valuation Report for This Property
The Home Valuation Report is an in-depth analysis detailing your home's value as well as a comparison with similar homes in the area
Home Values in the Area
Average Home Value in this Area
Purchase History
| Date | Buyer | Sale Price | Title Company |
|---|---|---|---|
| My Livable Homes Llc | $511,325 | None Available | |
| Fullman Barbara | $137,500 | None Available | |
| Marjam Properties Llc | $150,000 | None Available | |
| Demucci Louise B | -- | -- | |
| Demucci Louise B | $60,000 | -- |
Source: Public Records
Mortgage History
| Date | Status | Borrower | Loan Amount |
|---|---|---|---|
| Previous Owner | Marjam Properties Llc | $250,400 |
Source: Public Records
Tax History Compared to Growth
Tax History
| Year | Tax Paid | Tax Assessment Tax Assessment Total Assessment is a certain percentage of the fair market value that is determined by local assessors to be the total taxable value of land and additions on the property. | Land | Improvement |
|---|---|---|---|---|
| 2025 | $3,782 | $90,560 | $31,410 | $59,150 |
| 2024 | $3,782 | $90,560 | $31,410 | $59,150 |
| 2023 | $3,691 | $90,560 | $31,410 | $59,150 |
| 2022 | $3,616 | $90,560 | $31,410 | $59,150 |
| 2021 | $3,567 | $90,560 | $31,410 | $59,150 |
| 2020 | $3,550 | $90,560 | $31,410 | $59,150 |
| 2019 | $3,550 | $90,560 | $31,410 | $59,150 |
| 2018 | $3,550 | $90,560 | $31,410 | $59,150 |
| 2017 | $3,550 | $90,560 | $31,410 | $59,150 |
| 2016 | $3,386 | $90,560 | $31,410 | $59,150 |
| 2015 | $3,386 | $90,560 | $31,410 | $59,150 |
| 2014 | $3,386 | $90,560 | $31,410 | $59,150 |
Source: Public Records
Map
Nearby Homes
- 137 W Lancaster Ave
- 223 W Pennsylvania Ave
- 115 Whelen Ave
- 334 Mary St
- 390 Mary St
- 230 Church St
- 316 Bradford Ave
- 117 Abramo Victor Dr
- 129 Abramo Victor Dr
- 527 W Lancaster Ave
- 115 Victor Dr
- Chandler Plan at Downingtown Ridge - Chandler Townhomes
- Chase Plan at Downingtown Ridge - Chase Townhomes
- 298 Jefferson Ave Unit 12
- 335 E Lancaster Ave Unit E-5
- 316 Lincoln Ave
- 317 William Taft Ave
- 430 Jefferson Ave
- 514 E Lancaster Ave
- 23 Carlson Way
- 21 Stuart Ave
- 19 Stuart Ave
- 139 W Lancaster Ave
- 128 Western Ave
- 17 Stuart Ave
- 15 Stuart Ave
- 115 Stuart Ave
- 129 W Lancaster Ave
- 123 W Lancaster Ave
- 121 W Lancaster Ave Unit 3RD FL
- 121 W Lancaster Ave Unit 3
- 121 W Lancaster Ave
- 121 W Lancaster Ave Unit 2ND FLOOR
- 102 Stuart Ave
- 104 Stuart Ave
- 16 Stuart Ave
- 119 W Lancaster Ave
- 151 W Lancaster Ave Unit 1W
- 151 W Lancaster Ave Unit 3-E
- 151 W Lancaster Ave Unit 3-W