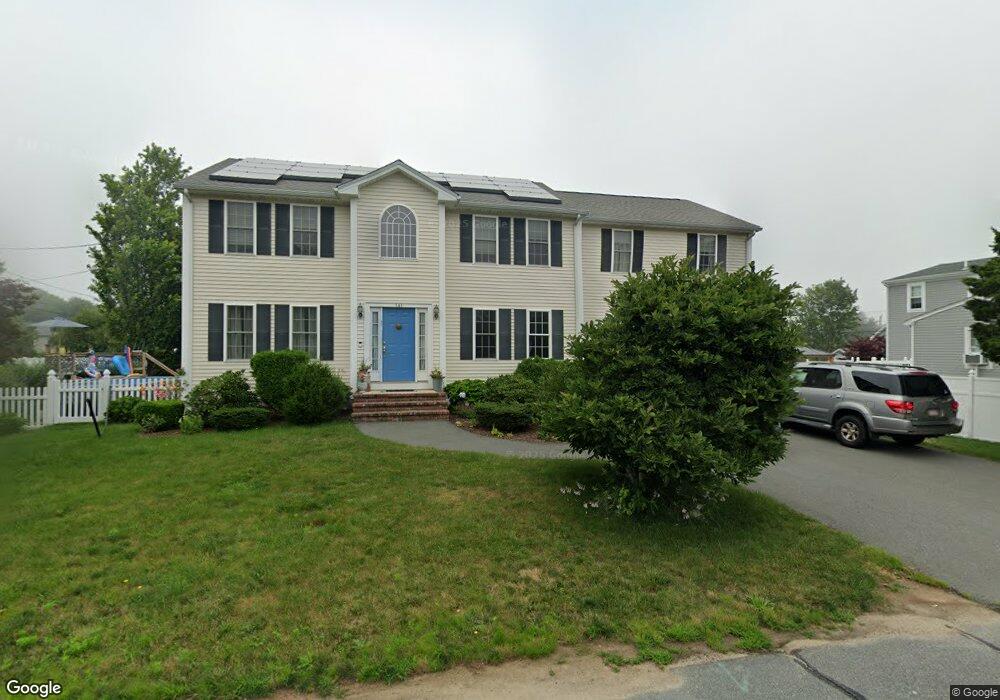
141 Willis St South Dartmouth, MA 02748
Dartmouth Community Park NeighborhoodEstimated Value: $770,113 - $862,000
4
Beds
3
Baths
2,536
Sq Ft
$319/Sq Ft
Est. Value
About This Home
This home is located at 141 Willis St, South Dartmouth, MA 02748 and is currently estimated at $808,278, approximately $318 per square foot. 141 Willis St is a home located in Bristol County with nearby schools including Dartmouth High School and St. Teresa of Calcutta School.
Ownership History
Date
Name
Owned For
Owner Type
Purchase Details
Closed on
May 27, 2008
Sold by
Verissimo Jorge
Bought by
Santos Annemarie and Santos Ryan A
Current Estimated Value
Home Financials for this Owner
Home Financials are based on the most recent Mortgage that was taken out on this home.
Original Mortgage
$348,000
Interest Rate
5.94%
Mortgage Type
Purchase Money Mortgage
Purchase Details
Closed on
Aug 23, 2006
Sold by
Partridge Lori E
Bought by
Verissimo Jorge
Create a Home Valuation Report for This Property
The Home Valuation Report is an in-depth analysis detailing your home's value as well as a comparison with similar homes in the area
Home Values in the Area
Average Home Value in this Area
Purchase History
| Date | Buyer | Sale Price | Title Company |
|---|---|---|---|
| Santos Annemarie | $435,000 | -- | |
| Verissimo Jorge | $160,000 | -- |
Source: Public Records
Mortgage History
| Date | Status | Borrower | Loan Amount |
|---|---|---|---|
| Open | Verissimo Jorge | $340,250 | |
| Closed | Verissimo Jorge | $348,000 | |
| Closed | Verissimo Jorge | $25,000 |
Source: Public Records
Tax History Compared to Growth
Tax History
| Year | Tax Paid | Tax Assessment Tax Assessment Total Assessment is a certain percentage of the fair market value that is determined by local assessors to be the total taxable value of land and additions on the property. | Land | Improvement |
|---|---|---|---|---|
| 2025 | $5,209 | $605,000 | $156,100 | $448,900 |
| 2024 | $5,051 | $581,300 | $148,900 | $432,400 |
| 2023 | $4,966 | $541,600 | $138,100 | $403,500 |
| 2022 | $4,530 | $457,600 | $132,100 | $325,500 |
| 2021 | $4,430 | $427,600 | $116,500 | $311,100 |
| 2020 | $4,414 | $425,200 | $116,500 | $308,700 |
| 2019 | $4,304 | $413,800 | $116,500 | $297,300 |
| 2018 | $142 | $390,200 | $116,500 | $273,700 |
| 2017 | $3,784 | $377,600 | $109,900 | $267,700 |
| 2016 | $3,803 | $374,300 | $109,900 | $264,400 |
| 2015 | $3,751 | $369,900 | $102,700 | $267,200 |
| 2014 | $3,613 | $353,900 | $93,200 | $260,700 |
Source: Public Records
Map
Nearby Homes