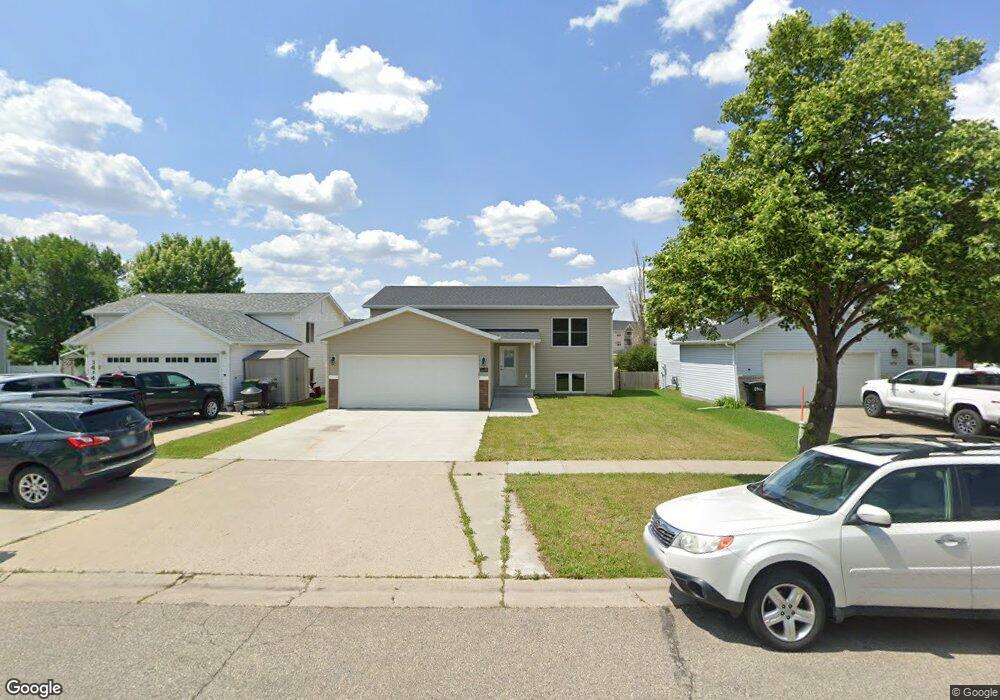
1410 11th St W West Fargo, ND 58078
Sheyenne Park NeighborhoodEstimated Value: $257,000 - $329,611
3
Beds
2
Baths
1,450
Sq Ft
$202/Sq Ft
Est. Value
About This Home
This home is located at 1410 11th St W, West Fargo, ND 58078 and is currently estimated at $293,306, approximately $202 per square foot. 1410 11th St W is a home located in Cass County with nearby schools including Westside Elementary School, Cheney Middle School, and West Fargo High School.
Ownership History
Date
Name
Owned For
Owner Type
Purchase Details
Closed on
Jun 13, 2025
Sold by
Lake Agassiz Habitat For Humanity Inc
Bought by
Aguek Garang Deng and Ayuen Reech Thiong Ayen
Current Estimated Value
Purchase Details
Closed on
Jun 28, 2022
Sold by
Lake Agassiz Habitat and Lake Humanity
Bought by
Roach Jamie
Home Financials for this Owner
Home Financials are based on the most recent Mortgage that was taken out on this home.
Original Mortgage
$94,600
Interest Rate
5.25%
Mortgage Type
New Conventional
Purchase Details
Closed on
May 30, 2020
Sold by
Tuttle Mary L and Tuttle Mark
Bought by
Lake Agassiz Habitat For Humanity Inc
Create a Home Valuation Report for This Property
The Home Valuation Report is an in-depth analysis detailing your home's value as well as a comparison with similar homes in the area
Home Values in the Area
Average Home Value in this Area
Purchase History
| Date | Buyer | Sale Price | Title Company |
|---|---|---|---|
| Aguek Garang Deng | $328,000 | The Title Company | |
| Roach Jamie | $273,900 | The Title Company | |
| Lake Agassiz Habitat For Humanity Inc | -- | None Available |
Source: Public Records
Mortgage History
| Date | Status | Borrower | Loan Amount |
|---|---|---|---|
| Previous Owner | Roach Jamie | $94,600 | |
| Previous Owner | Roach Jamie | $182,300 |
Source: Public Records
Tax History Compared to Growth
Tax History
| Year | Tax Paid | Tax Assessment Tax Assessment Total Assessment is a certain percentage of the fair market value that is determined by local assessors to be the total taxable value of land and additions on the property. | Land | Improvement |
|---|---|---|---|---|
| 2024 | $4,044 | $111,600 | $17,500 | $94,100 |
| 2023 | $2,094 | $63,550 | $17,500 | $46,050 |
| 2022 | $3,442 | $111,350 | $17,500 | $93,850 |
| 2021 | $958 | $12,000 | $11,250 | $750 |
| 2020 | $971 | $12,600 | $11,250 | $1,350 |
| 2019 | $844 | $12,550 | $11,250 | $1,300 |
| 2018 | $2,660 | $83,250 | $11,250 | $72,000 |
| 2017 | $2,598 | $82,600 | $11,250 | $71,350 |
| 2016 | $2,338 | $79,900 | $11,250 | $68,650 |
| 2015 | $2,335 | $73,050 | $7,900 | $65,150 |
| 2014 | $2,300 | $68,250 | $7,900 | $60,350 |
| 2013 | $2,170 | $67,000 | $7,900 | $59,100 |
Source: Public Records
Map
Nearby Homes
- 830 12th Ave W
- 1447 Elmwood Ct
- 723 16th Ave W
- 1165 7th Ave W
- 744 Elm St
- 1179 Highland Ln W
- 1234 Highland Ln W
- 1029 Highland Ln W
- 719 5th Ave W
- 232 15th Ave W
- 1633 3rd St W
- 514 7th Ave W
- 520 6th Ave W Unit 8
- 226 10 1/2 Ave W
- 1264 Marlys Dr W
- 2101 10th St W
- 2124 14th St W
- 1844 1st St
- 134 17th Ave E
- 2170 Dock Dr