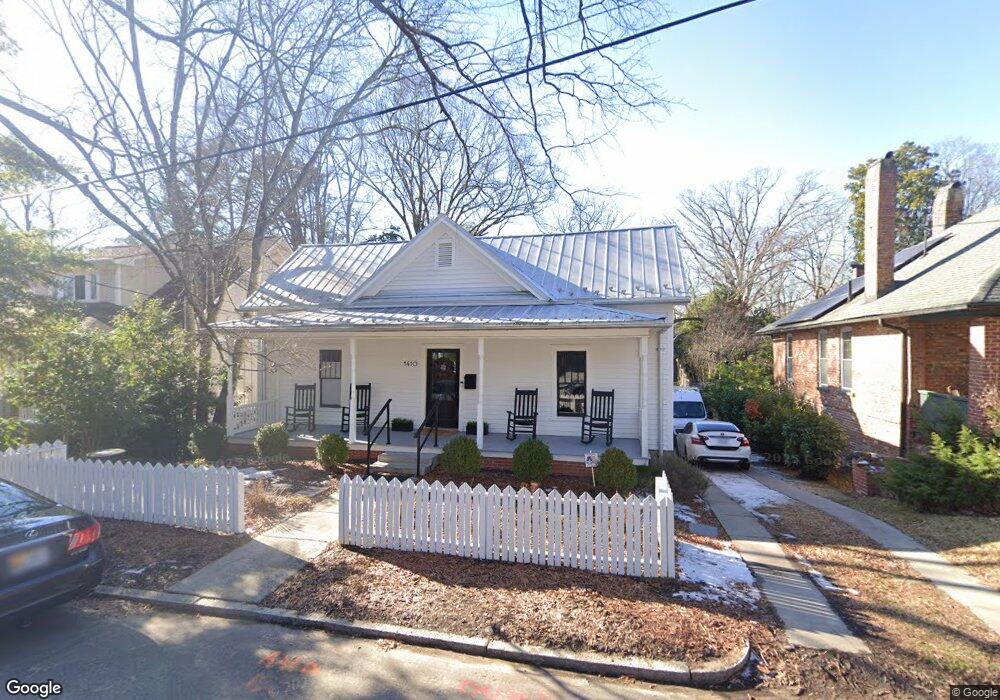
1410 James St Durham, NC 27707
Tuscaloosa-Lakewood NeighborhoodEstimated Value: $492,570 - $666,000
2
Beds
2
Baths
1,667
Sq Ft
$342/Sq Ft
Est. Value
About This Home
This home is located at 1410 James St, Durham, NC 27707 and is currently estimated at $570,643, approximately $342 per square foot. 1410 James St is a home located in Durham County with nearby schools including Morehead Montessori, Lakewood Elementary School, and Lakewood Montessori Middle School.
Ownership History
Date
Name
Owned For
Owner Type
Purchase Details
Closed on
Dec 19, 2019
Sold by
Burleson Johnny Dwight and Clark Walter Foy
Bought by
Larson Jonathan P and Larson Mary Kay
Current Estimated Value
Home Financials for this Owner
Home Financials are based on the most recent Mortgage that was taken out on this home.
Original Mortgage
$392,800
Outstanding Balance
$346,310
Interest Rate
3.6%
Mortgage Type
New Conventional
Estimated Equity
$224,333
Purchase Details
Closed on
Apr 20, 2017
Sold by
Springle Buna P Estate
Bought by
Burleson Johnny Dwight and Clark Walter Foy
Home Financials for this Owner
Home Financials are based on the most recent Mortgage that was taken out on this home.
Original Mortgage
$353,400
Interest Rate
4.23%
Mortgage Type
New Conventional
Purchase Details
Closed on
Nov 3, 2015
Sold by
Springle Buna P and Pickett Buna Leigh
Bought by
Springle Buna P and Mcnair Bonnie
Create a Home Valuation Report for This Property
The Home Valuation Report is an in-depth analysis detailing your home's value as well as a comparison with similar homes in the area
Home Values in the Area
Average Home Value in this Area
Purchase History
| Date | Buyer | Sale Price | Title Company |
|---|---|---|---|
| Larson Jonathan P | $491,000 | None Available | |
| Burleson Johnny Dwight | $150,000 | -- | |
| Springle Buna P | -- | Attorney |
Source: Public Records
Mortgage History
| Date | Status | Borrower | Loan Amount |
|---|---|---|---|
| Open | Larson Jonathan P | $392,800 | |
| Previous Owner | Burleson Johnny Dwight | $353,400 |
Source: Public Records
Tax History
| Year | Tax Paid | Tax Assessment Tax Assessment Total Assessment is a certain percentage of the fair market value that is determined by local assessors to be the total taxable value of land and additions on the property. | Land | Improvement |
|---|---|---|---|---|
| 2025 | $4,653 | $469,422 | $282,000 | $187,422 |
| 2024 | $4,073 | $291,978 | $48,160 | $243,818 |
| 2023 | $3,825 | $291,978 | $48,160 | $243,818 |
| 2022 | $3,737 | $291,978 | $48,160 | $243,818 |
| 2021 | $3,720 | $291,978 | $48,160 | $243,818 |
| 2020 | $3,632 | $291,978 | $48,160 | $243,818 |
| 2019 | $3,632 | $291,978 | $48,160 | $243,818 |
| 2018 | $2,030 | $149,656 | $45,150 | $104,506 |
| 2017 | $2,015 | $149,656 | $45,150 | $104,506 |
| 2016 | $1,947 | $149,656 | $45,150 | $104,506 |
| 2015 | $2,080 | $150,278 | $28,448 | $121,830 |
| 2014 | $2,080 | $150,278 | $28,448 | $121,830 |
Source: Public Records
Map
Nearby Homes
- 1518 Echo Rd
- 1202 A Moreland Ave
- 1202 B Moreland Ave
- 2008 Ward St
- 1406 Gunter St
- 2307 Chapel Hill Rd
- 1427 Bivins St
- 1700 Rosedale Ave
- 1125 Anderson St
- 1809 Morehead Ave
- 1919 Morehead Ave
- 1023 Anderson St
- 2209 Morehead Ave
- 1031 Cornell St
- 2502 Chapel Hill Rd Unit A
- 2502 Chapel Hill Rd Unit B
- 1025 Cornell St
- 1712 Rosedale Ave
- 1023 W Lakewood Ave
- 1101 Fairview St
- 1408 James St
- 1412 James St
- 1414 James St
- 2000 Redfern Way Unit 4
- 1406 James St
- 1418 James St
- 1012 Redfern Way Unit lot3
- 1012 Redfern Way
- 2008 Redfern Way
- 1008 Redfern Way
- 1903 W Lakewood Ave
- 1901 W Lakewood Ave
- 2012 Redfern Way
- 1907 W Lakewood Ave
- 1413 James St
- 1409 James St
- 1420 James St
- 1415 James St
- 1407 James St
- 1809 W Lakewood Ave
Your Personal Tour Guide
Ask me questions while you tour the home.